
Right now: Sacramento is at 38, good.
Is the air safe to breathe in Sacramento today?
In Sacramento, BreatheCheck reads 38 as Go. The cutoffs: go below 101, keep it short and easy from 101 to 150, move it indoors above 150. These are our own thresholds, drawn on the EPA bands — EPA itself classifies 101–150 as Unhealthy for Sensitive Groups and does not tell you how long to stay out.
Go AQI 0–100
Normal outdoor plans. No change needed.
Short & unloaded AQI 101–150
A 20-minute dog walk, not a 2.5-hour run. Keep it brief and easy.
Don’t go AQI 151+
Move it indoors. Above 200 that becomes everyone, not just sensitive groups.
Above 200 this stops being a personal call: everyone indoors.
Duration and intensity are two separate dials
| Under 20 min | 20–60 min | Over an hour | |
|---|---|---|---|
| Easy | Go | Go | Go |
| Moderate | Go | Go | Go |
| Hard | Go | Go | Go |
Go Every combination lands the same way at this reading — a hard hour is no different from an easy twenty minutes. The two dials separate above 80.
Where people actually draw the line
All the thresholds people reported, and who reported them
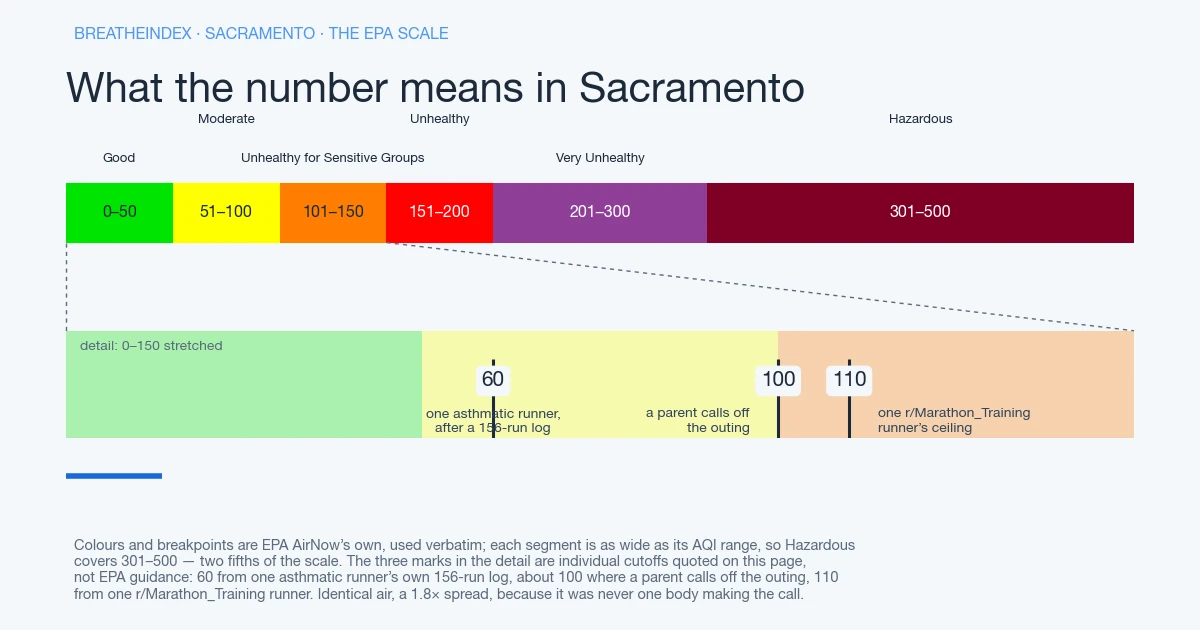
- 60 Asthmatic runnerone runner’s own 156-run log
- 75–100 Daycare / schoolparents and staff in one r/toddlers thread, Aug 2025 — not a published rule
- 100 Parentcommunity-reported, escalating at 150 and 200
- 110 Runnercommunity-reported
If you’re staying in, filter the room you’re actually in
That color and number are today’s read on air quality Sacramento sees right now. What they’re deciding is smaller than the headline: the river-trail run, the kid’s after-school game, whether the windows stay open tonight. This page also tracks the air Sacramento has actually breathed since we began measuring here, not just the one figure updating above. Set your own number instead — an email when the winter lid or the smoke crosses it.
How does today compare with Sacramento’s record so far?
Since 16 August 2026 we have recorded 30 days for Sacramento. 0 went above AQI 100, and the highest daily maximum was 72, on 22 August 2026. The day-by-day record is further down.
One reading says nothing about the shape behind it. BreatheCheck rebuilds the air quality Sacramento has seen since we began measuring here, from the same hourly AQI feed as the number above.
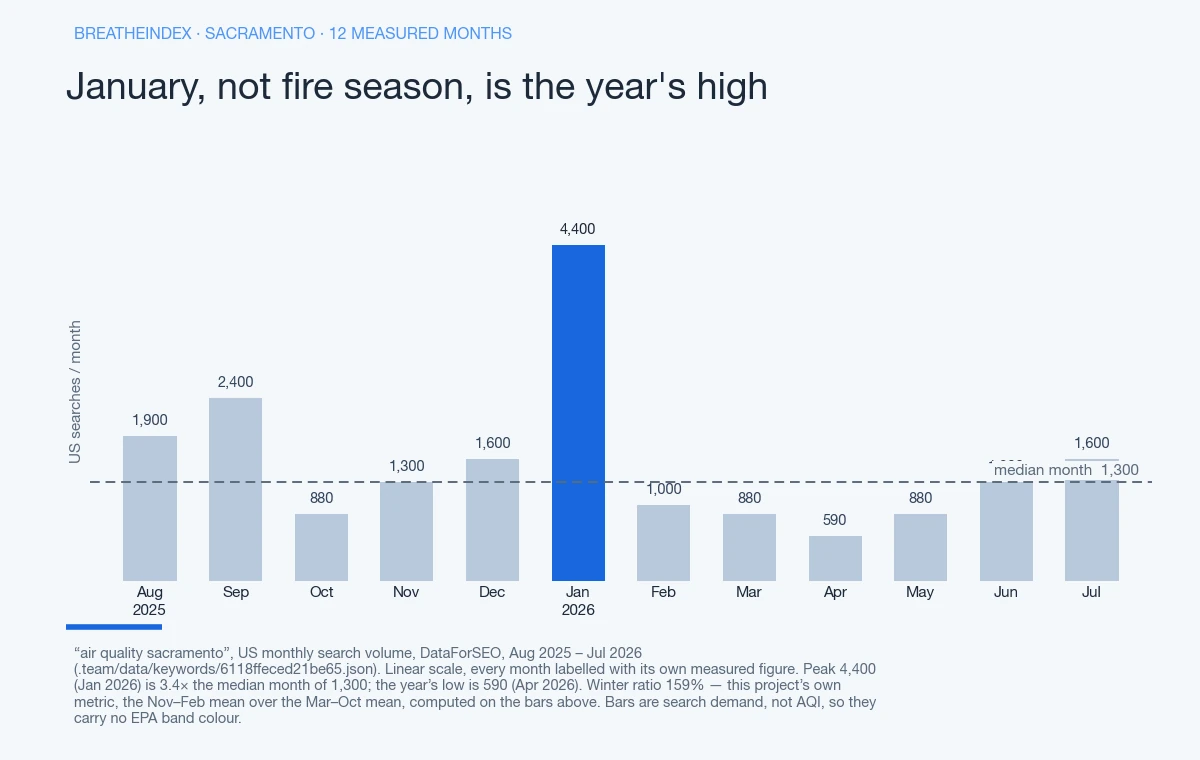
The page also carries a running count of days above AQI 100 since we began counting. IQAir, AccuWeather, aqicn and the state’s own monitor grid hand you today’s number and stop there. None of them renders the shape over time. Sacramento’s own search-interest data already hints at that shape before a single day of AQI history even loads. January runs at 4,400 against a median month of 1,300. Weighed the way this project weighs every metro, Sacramento’s winter ratio comes out to 159%. That figure is the November-February mean against the March-October mean, second only to Salt Lake City’s 153%. A city most people associate with fire season turns out to have its heaviest search interest in winter.
Why is it hazy in Sacramento today
Sacramento sits at the northern tip of California’s Central Valley, where the Sacramento Valley meets the Sacramento–San Joaquin River Delta. In winter, cold air settles onto the valley floor and a warmer layer caps it from above. That’s the same cold-air-pool mechanism that traps wintertime particulate matter across the wider Central Valley. Three things can also make the sky look worse than the number: 24-hour averaging, smoke sitting aloft, or a distant station.
The Delta itself complicates that picture rather than simplifying it: cooler marine air pulled in off the Bay through the Delta helps scour the basin clear on many afternoons, the way Santa Ana winds do for Los Angeles, but that flushing mechanism can shut off for days during a stagnant winter pattern. The AQI’s smoothing across recent hours holds back a rough morning across the calmer hours that follow it; smoke from a fire elsewhere in the state can sit aloft, above the ground-level monitor doing the measuring; or the nearest working station is miles off, standing in for a metro that runs from downtown out past the suburbs and into the Delta towns. None of that makes the haze fake — one number averages one location, not your block. Delta wind, a winter lid, and an averaged number breaks each cause down.
What is causing the bad air in Sacramento
Two sources trade off across a Sacramento year, and neither is a single wildfire event working alone. In winter, fine particulate matter (PM2.5) from vehicle exhaust and wood-burning stoves gets trapped by the valley’s cold-air pool. That’s the same broad mechanism behind Bakersfield’s and Fresno’s winter smog to the south, at the Valley’s northern, Delta-adjacent edge. In summer and early fall, the dominant source flips: wildfire smoke drifts in from the Sierra Nevada foothills.
That smoke points further north too. Ground-level ozone, cooked out of vehicle exhaust on hot, still afternoons, adds to it. No Sacramento-specific community account of either mechanism turned up in the material this project has reviewed — no local quote exists to attribute, in either direction. What’s confirmed is the airshed pattern itself: Bay Area/Delta influence layered on the northern edge of the Central Valley’s winter inversion. That’s a documented pattern, not a resident’s own words — stated here rather than an invented quote.
Is the air safe to breathe in Sacramento today
Sacramento sits where the Central Valley narrows toward the Delta. Cooler marine air pulled in through that gap can complicate a cold-air-pool reading instead of clearing it. A calmer-looking afternoon here doesn’t always mean a cleaner one. Go on an ordinary reading. Short and unloaded: the short warmup jog instead of the tempo run along the American River. Don’t go once the number climbs into red.
On EPA’s scale, everyone is warned starting at 151, Unhealthy. 201 to 300, Very Unhealthy, is that same warning at a harder edge, not a new group. Past roughly 200, Delta breeze or not, the plan moves indoors.
What AQI should you stay inside
A 1.8x spread separates a runner’s ceiling from an asthmatic’s — 110 against 60. The asthmatic number comes from 156 logged runs against AQI. Past that line, “my lungs struggle regardless of how well I’ve trained,” despite EPA calling nothing under 100 unhealthy.
The same log shows 87% success under 50, dropping to 42% between 50 and 70, 12% past 70. The runner’s 110 comes from r/Marathon_Training: “I’ll run in up to 110 because…error bars.” Parents this project has seen online split the difference, near 100.
California’s own agencies haven’t set a school or daycare AQI cutoff, nothing this project could confirm either way. The Washington and Minnesota numbers are sourced, but to individuals describing their own centres, not to any state rule. Where the reported numbers come from has both. Ask your own provider for the written version.
Smoke, arriving separately from the valley’s own cold-air-pool winter pattern, still drags that whole table down about one more EPA band once it shows up. 101–150 falls in EPA’s Unhealthy for Sensitive Groups band, an agency classification rather than a call on any one reader. A portable HEPA purifier, or a Corsi-Rosenthal box built for around $130 in a 12x14 bedroom, is the indoor default here too. Don’t jump to a whole-house MERV-13 filter without a licensed tech’s static-pressure check first — the wrong system just chokes on it. Whether the purifier was worth it takes the question further.
Why our number may not match what you are seeing and smelling
The mismatch cuts two directions here. A clear, still afternoon with no visible haze can still carry an AQI in the 100s. Ground-level ozone, this metro’s dominant summer pollutant, is invisible and odorless — check the number instead of the sky. A smoky-looking sky with a surprisingly calm number is usually smoothing across recent hours diluting a rough hour, or smoke sitting aloft above the monitor.
That smoke drifted in from a fire well outside the metro. Neither direction is the fake one — the number and your senses are measuring different things.
Today’s reading for Sacramento comes from AirNow’s Sacramento reporting area, whose reference point sits about 1.5 miles from the metro centre. As of .
A station miles off under-reports whichever part of the metro, from the urban core out to the Delta towns, sits farthest from it. Why the Delta towns and the urban core can split covers that gap.
Why Sacramento air gets worse in winter
Search interest for air quality Sacramento runs opposite what most visitors expect from a California capital associated with fire season. January measures 4,400 against a median month of 1,300. Sacramento’s winter ratio — Nov-Feb mean over Mar-Oct mean — lands at 159%, trailing only Salt Lake City’s 153%. Winter, not summer wildfire smoke, drives Sacramento’s heaviest search interest, making it a genuinely counter-seasonal metro.
The mechanism is the Central Valley’s winter cold-air pool, sitting at the Valley’s northern edge where Bay Area and Delta airflow also reach the basin. Cold, dense air settles onto the valley floor, and a warmer layer caps it from above, so wintertime PM2.5 from vehicles and wood-burning stoves can sit for days rather than clearing in an afternoon. Whether the Delta breeze reliably breaks that winter pattern here isn’t something this project has sourced — the breeze is the afternoon marine push through the Delta that can scour the basin the rest of the year. The honest answer: it sometimes does and sometimes doesn’t, and a stalled winter pattern is exactly when it doesn’t.
Summer flips the mechanism again. Wildfire smoke drifts down from Sierra Nevada and Northern California fires. Ground-level ozone builds from sunlight and vehicle exhaust on hot, still days. Fresno and Bakersfield share the same Central Valley cold-air-pool mechanism further south, while Oakland sits across the Bay Area/Delta airshed. Further out, the same bimodal winter-inversion-plus-fire-season shape shows up elsewhere too. Salt Lake City’s Wasatch Front inversion is the clearest case, and Spokane’s Pacific Northwest smoke corridor and Boise’s Great Basin winter pattern share it too.
Where this number sits
Of the 121 US metros reporting to us right now, Sacramento is number 64 and number 12 of the 12 we track in California. The pollutant driving it today is O3.
Nearby metros we also measure, and what they read at the same hour:
- Stockton, CA — 44 miles away, AQI 51
- Oakland, CA — 69 miles away, AQI 48
- San Jose, CA — 88 miles away, AQI 51
- Reno, NV — 112 miles away, AQI 43
Where this reading comes from
AirNow’s Sacramento reporting area, about 1.5 miles from the metro centre.
What has air quality in Sacramento actually been?
0 of the 30 days we have recorded so far went above AQI 100.
| Date | Daily max AQI | EPA band | Hours read |
|---|---|---|---|
| 54 | Moderate | 23 | |
| 48 | Good | 24 | |
| 53 | Moderate | 24 | |
| 52 | Moderate | 24 | |
| 52 | Moderate | 24 | |
| 56 | Moderate | 24 | |
| 67 | Moderate | 24 | |
| 44 | Good | 24 | |
| 44 | Good | 24 | |
| 44 | Good | 25 | |
| 43 | Good | 24 | |
| 47 | Good | 24 | |
| 57 | Moderate | 24 | |
| 49 | Good | 24 | |
| 57 | Moderate | 24 | |
| 56 | Moderate | 24 | |
| 41 | Good | 24 | |
| 45 | Good | 23 | |
| 48 | Good | 24 | |
| 44 | Good | 24 | |
| 39 | Good | 24 | |
| 48 | Good | 24 | |
| 65 | Moderate | 24 | |
| 72 | Moderate | 24 | |
| 50 | Good | 24 | |
| 50 | Good | 24 | |
| 54 | Moderate | 24 | |
| 61 | Moderate | 24 | |
| 50 | Good | 27 | |
| 43 | Good | 13 — partial day |
Questions about Sacramento
What is the air quality in Sacramento right now?
Which monitor does this number come from?
How does Sacramento compare with metros nearby?
Does this include pollen?
Put this number in context
Updated