
Right now: Oakland is at 48, good.
Is the air safe to breathe in Oakland today?
In Oakland, BreatheCheck reads 48 as Go. The cutoffs: go below 101, keep it short and easy from 101 to 150, move it indoors above 150. These are our own thresholds, drawn on the EPA bands — EPA itself classifies 101–150 as Unhealthy for Sensitive Groups and does not tell you how long to stay out.
Go AQI 0–100
Normal outdoor plans. No change needed.
Short & unloaded AQI 101–150
A 20-minute dog walk, not a 2.5-hour run. Keep it brief and easy.
Don’t go AQI 151+
Move it indoors. Above 200 that becomes everyone, not just sensitive groups.
Above 200 this stops being a personal call: everyone indoors.
Duration and intensity are two separate dials
| Under 20 min | 20–60 min | Over an hour | |
|---|---|---|---|
| Easy | Go | Go | Go |
| Moderate | Go | Go | Go |
| Hard | Go | Go | Go |
Go Every combination lands the same way at this reading — a hard hour is no different from an easy twenty minutes. The two dials separate above 80.
Where people actually draw the line
All the thresholds people reported, and who reported them
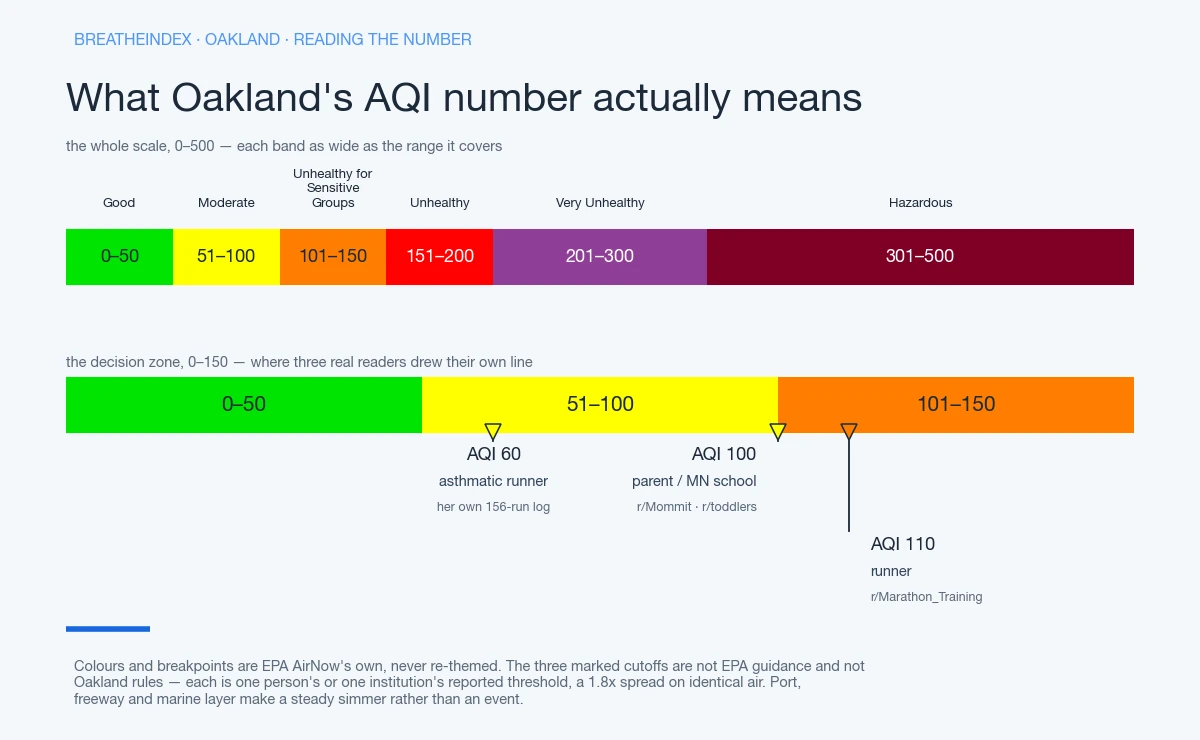
- 60 Asthmatic runnerone runner’s own 156-run log
- 75–100 Daycare / schoolparents and staff in one r/toddlers thread, Aug 2025 — not a published rule
- 100 Parentcommunity-reported, escalating at 150 and 200
- 110 Runnercommunity-reported
If you’re staying in, filter the room you’re actually in
Whatever’s glowing above this line is Oakland’s own call today — the color first, no wading through a number to get there. The air quality Oakland reports isn’t borrowed from San Francisco across the water, or from the Central Valley inland. It’s its own reading, its own station. It decides something ordinary. The walk around Lake Merritt. Whether the kid’s soccer practice moves indoors. Whether tonight’s the night the windows stay shut against the fog. BreatheCheck tracks what Oakland has actually breathed since we began measuring here, not just the figure sitting above it. Set your own threshold and let a message find you when it’s crossed.
How does today compare with Oakland’s record so far?
Since 16 August 2026 we have recorded 30 days for Oakland. 3 went above AQI 100, and the highest daily maximum was 139, on 9 September 2026. The day-by-day record is further down.
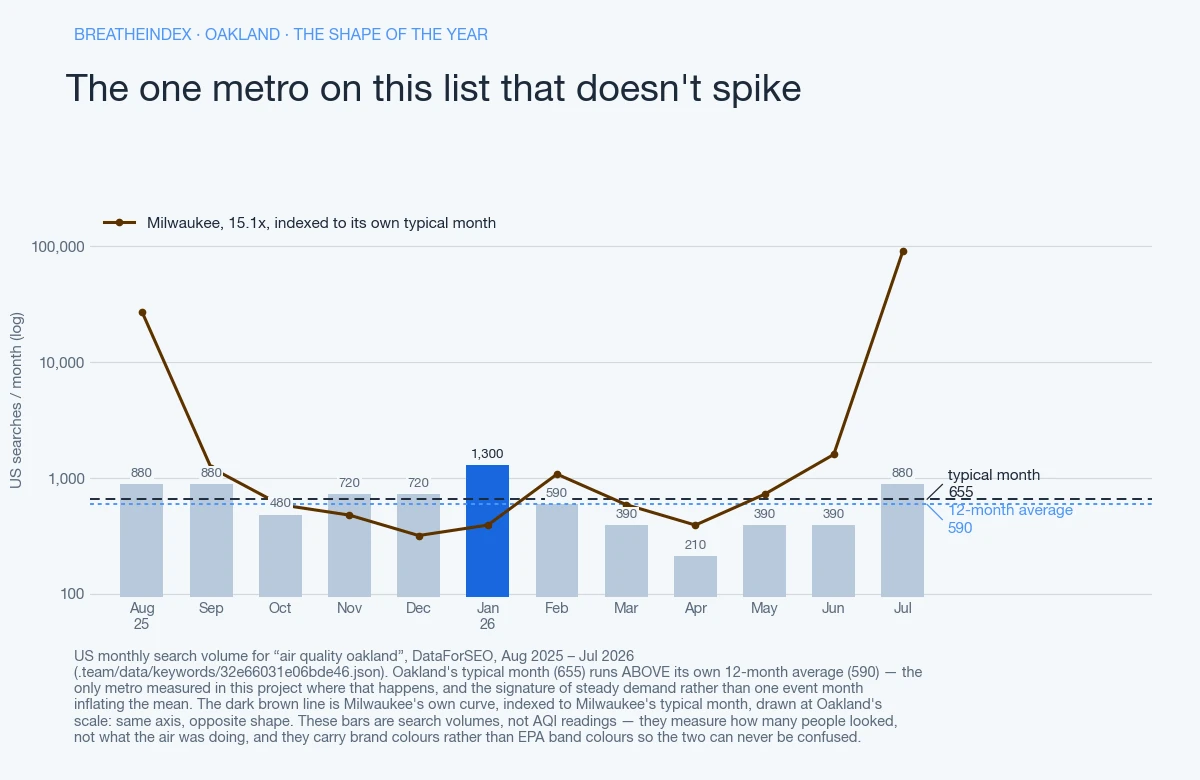
The one metro on this list that doesn’t spike. Search volumes, not AQI readings — bars are neutral blue-grey with the peak month in accent blue, never EPA band colours, so demand data can never be read as a measurement of the air.
A single reading can’t say whether today is ordinary or a spike. Our own record, further down this page, rebuilds the air quality Oakland has actually seen since we began measuring here, from the same hourly AQI feed as the number above. It also carries a running count of days above AQI 100 since we began counting. Oakland’s own search-demand pattern is unusual for this project: it doesn’t spike and crash the way a wildfire city’s does. The full numbers are below, in “The one metro on this list that doesn’t spike.” That shape tracks with the mechanism itself — Oakland’s pollution isn’t one dramatic event most years. It’s a low, steady simmer.
Why is it hazy in Oakland today?
Three explanations cover most hazy-but-moderate days here. Smoothing across recent hours can hold back one genuinely rough hour. Smoke can sit aloft, above whatever’s actually measuring ground level. Or the monitoring station stands in for a stretch of metro it isn’t really next to. Oakland adds a fourth wrinkle: fog. The Bay’s marine layer can sit low and gray for days without carrying any real pollution at all.
A visually hazy sky here often isn’t a bad-air day, just a foggy one. Reading the number, not the sky, is the only way to tell them apart. In June 2026, a warehouse fire in Tracy (roughly 60 miles east) sent smoke blowing toward the region. The original poster opened with a hedge of their own: “I know Tracy isn’t technically Bay Area.” Their post, dated 6/11/26, said the warehouse “is still burning.” Officially, “No deaths reported” had come through, but the video they’d taken made them want to be “cautious.” That’s a point-source industrial fire, not a wildfire and not an Oakland event — the kind of thing a station-distance hedge exists for. Port traffic, freeway exhaust, and no single spike works through each cause.
What is causing the bad air in Oakland?
Oakland’s air quality doesn’t run on one dramatic mechanism. It isn’t a wildfire city or an inversion valley, and ground-level ozone isn’t doing the damage the way it does in a sunnier inland metro. Two ordinary sources do most of the work, both constant rather than seasonal. The Bay’s marine layer traps fine particulate matter (PM2.5) and coarser dust (PM10). The Port of Oakland’s truck and cargo traffic sits underneath it.
That marine layer is the same process behind the region’s famous summer fog, trapping whatever’s already in the air close to the ground. The port traffic sits alongside the I-880, I-80 and I-580 corridors that converge here. The Bay Area Air Quality Management District (BAAQMD) is the regulator that tracks this corridor specifically, separate from the state agency that covers inland California. Wildfire smoke still reaches Oakland in a bad year, usually drifting in from fires well outside the city. One Bay Area resident put the regional fatigue plainly, in a thread about oil-and-gas leasing on public land. “We already deal with enough wildfire smoke without adding more drilling.” That’s the exception, not the baseline — most days, the port and the freeways do the polluting, not a fire.
What makes the call different in Oakland?
The Bay’s marine layer sits low and gray for days without carrying much real pollution. A hazy-looking sky here is more often fog than a bad-air day. Go, unchanged, on an ordinary reading. Short and unloaded: the shorter dog loop around the lake, errands instead of yard work. Don’t go past that, rare as the trigger is here.
EPA opens its everyone-warning at 151, Unhealthy, and 201 to 300, Very Unhealthy, is that same warning restated more seriously, not a new group. Past roughly 200 — an unusual reading for Oakland — the plan moves indoors regardless.
What AQI should you stay inside?
For a California-specific daycare or school AQI rule, this project found nothing published. Washington and Minnesota turn up only as a teacher and parents describing their own centres. Which states publish an outdoor-play threshold covers both.
On the days Oakland does spike, personal thresholds run well under the EPA’s single sensitive-groups line, same as anywhere. An asthmatic runner logged 156 runs against AQI and drew a hard ceiling at 60. Past it, “my lungs struggle regardless of how well I’ve trained,” even though EPA calls nothing under 100 unhealthy. That log: 87% of runs under 50 went fine, 42% between 50 and 70, just 12% past 70. A r/Marathon_Training runner goes almost double that: “I’ll run in up to 110 because…error bars.” Parents online tend to land near 100.
Wildfire smoke is the rare event that actually moves Oakland’s number away from its usual baseline. It pulls that whole table down about one EPA band. EPA’s label for that range is the Unhealthy for Sensitive Groups band, a classification rather than a diagnosis.
Indoors, a Corsi-Rosenthal box or a portable HEPA purifier is the default, priced by one community builder at $130 for a 12x14 bedroom. A MERV-13 swap needs a static-pressure check from a licensed tech first, and most homes here rarely need one at all. Monitor, filter, purifier — in that order explains the sequence.
Why our number may not match what you are seeing and smelling
Fog is the case that trips people up most here. A gray, socked-in morning can carry a genuinely good AQI number, because marine-layer fog is water, not particulate. The sky can look worse than the reading and simply be wrong to distrust. The opposite mismatch happens too: a clear day with wildfire smoke sitting aloft above the ground-level monitor.
Or the station on record stands in for a stretch of the metro closer to the port than to where a reader actually is.
Today’s reading for Oakland comes from AirNow’s Oakland reporting area, whose reference point sits about 0 miles from the metro centre. As of .
That station is worth checking specifically here — the port corridor and the hills read differently from each other more than in most single-mechanism cities. Why the port corridor and the hills read differently covers that split.
The one metro on this list that doesn’t spike
Search interest in Oakland’s air quality follows a shape most cities in this project don’t share. Elsewhere the pattern is a quiet baseline most of the year, then a wildfire month that spikes search interest 15 times past normal. That’s the way Milwaukee’s does it. Oakland doesn’t. Its median month (655) actually runs above its own 12-month average (590) — the only metro measured where that’s true.
Winter alone holds at 148% of the yearly baseline, and its cost per click, $10.05, is the highest anywhere in this project’s second tier. Nobody’s checking Oakland’s air quality because of one bad week — the port, the freeways and the marine layer are a fact of living, year-round. Sacramento shares the wider Bay Area and Delta airshed. The port-and-freeway mechanism itself runs the same playbook along Houston’s ship channel, Long Beach’s port complex and Pittsburgh’s industrial river corridor. Different coasts, same kind of constant source.
Where this number sits
Of the 121 US metros reporting to us right now, Oakland is number 35 and number 9 of the 12 we track in California. The pollutant driving it today is PM2.5.
Nearby metros we also measure, and what they read at the same hour:
- San Jose, CA — 38 miles away, AQI 51
- Stockton, CA — 55 miles away, AQI 51
- Sacramento, CA — 69 miles away, AQI 38
- Fresno, CA — 155 miles away, AQI 70
Where this reading comes from
AirNow’s Oakland reporting area, about 0 miles from the metro centre.
What has air quality in Oakland actually been?
3 of the 30 days we have recorded so far went above AQI 100.
| Date | Daily max AQI | EPA band | Hours read |
|---|---|---|---|
| 48 | Good | 23 | |
| 70 | Moderate | 21 | |
| 93 | Moderate | 21 | |
| 73 | Moderate | 23 | |
| 77 | Moderate | 23 | |
| 139 | Unhealthy for Sensitive Groups | 23 | |
| 62 | Moderate | 23 | |
| 87 | Moderate | 23 | |
| 80 | Moderate | 21 | |
| 88 | Moderate | 21 | |
| 61 | Moderate | 23 | |
| 60 | Moderate | 24 | |
| 49 | Good | 23 | |
| 53 | Moderate | 23 | |
| 102 | Unhealthy for Sensitive Groups | 23 | |
| 76 | Moderate | 21 | |
| 93 | Moderate | 21 | |
| 74 | Moderate | 22 | |
| 64 | Moderate | 23 | |
| 73 | Moderate | 23 | |
| 67 | Moderate | 23 | |
| 79 | Moderate | 24 | |
| 108 | Unhealthy for Sensitive Groups | 21 | |
| 80 | Moderate | 22 | |
| 69 | Moderate | 24 | |
| 58 | Moderate | 24 | |
| 68 | Moderate | 23 | |
| 70 | Moderate | 23 | |
| 70 | Moderate | 26 | |
| 83 | Moderate | 13 — partial day |
Questions about Oakland
What is the air quality in Oakland right now?
Which monitor does this number come from?
How does Oakland compare with metros nearby?
Does this include pollen?
Put this number in context
Updated