
Right now: Long Beach is at 50, good.
Is the air safe to breathe in Long Beach today?
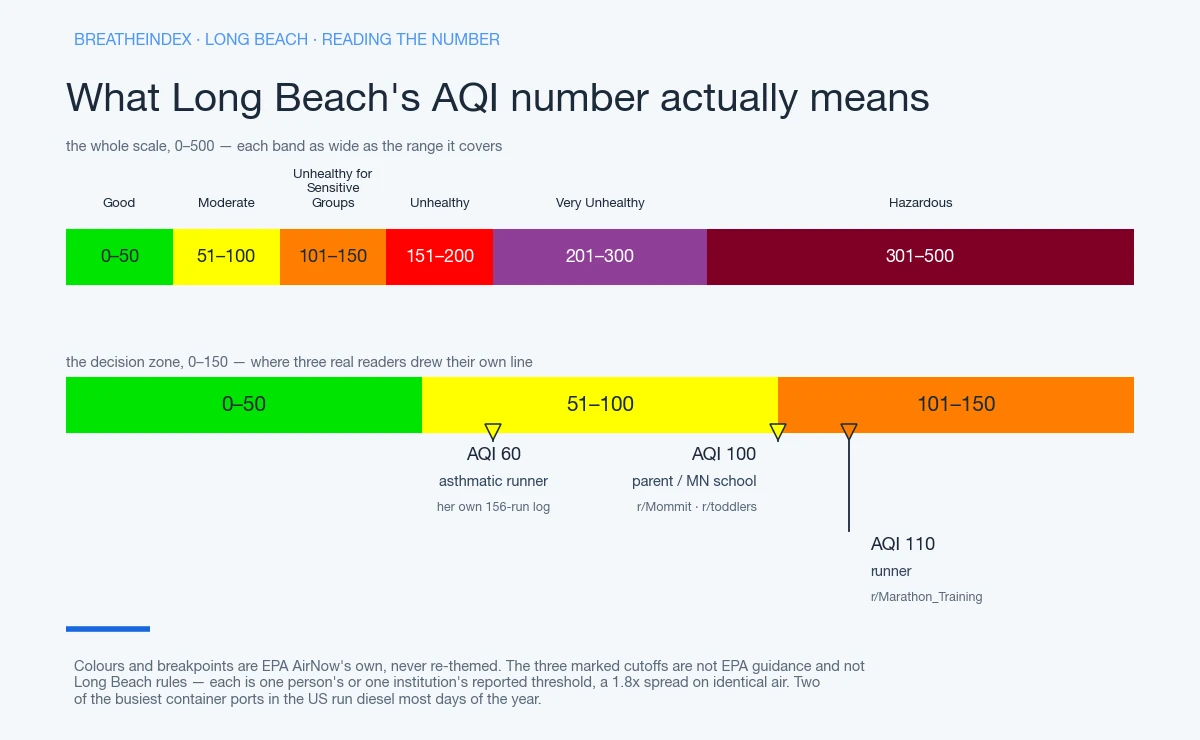
In Long Beach, BreatheCheck reads 50 as Go. The cutoffs: go below 101, keep it short and easy from 101 to 150, move it indoors above 150. These are our own thresholds, drawn on the EPA bands — EPA itself classifies 101–150 as Unhealthy for Sensitive Groups and does not tell you how long to stay out.
Go AQI 0–100
Normal outdoor plans. No change needed.
Short & unloaded AQI 101–150
A 20-minute dog walk, not a 2.5-hour run. Keep it brief and easy.
Don’t go AQI 151+
Move it indoors. Above 200 that becomes everyone, not just sensitive groups.
Above 200 this stops being a personal call: everyone indoors.
Duration and intensity are two separate dials
| Under 20 min | 20–60 min | Over an hour | |
|---|---|---|---|
| Easy | Go | Go | Go |
| Moderate | Go | Go | Go |
| Hard | Go | Go | Go |
Go Every combination lands the same way at this reading — a hard hour is no different from an easy twenty minutes. The two dials separate above 80.
Where people actually draw the line
All the thresholds people reported, and who reported them
- 60 Asthmatic runnerone runner’s own 156-run log
- 75–100 Daycare / schoolparents and staff in one r/toddlers thread, Aug 2025 — not a published rule
- 100 Parentcommunity-reported, escalating at 150 and 200
- 110 Runnercommunity-reported
If you’re staying in, filter the room you’re actually in
The number above is Long Beach’s own, not a rounding error off Los Angeles next door. It decides something concrete. The walk on the Shoreline path. Whether soccer practice moves indoors. Whether the windows stay open tonight against the diesel drifting off the harbor. BreatheCheck tracks the air quality Long Beach itself has actually breathed since we began measuring here, not just the figure sitting above it. Set your own line and let an email tell you when the port air crosses it.
How does today compare with Long Beach’s record so far?
Since 16 August 2026 we have recorded 30 days for Long Beach. 1 went above AQI 100, and the highest daily maximum was 105, on 11 September 2026. The day-by-day record is further down.
A single reading can’t say whether today is ordinary or a genuine spike. Our own record, further down this page, rebuilds the air quality Long Beach has actually seen since we began measuring here.
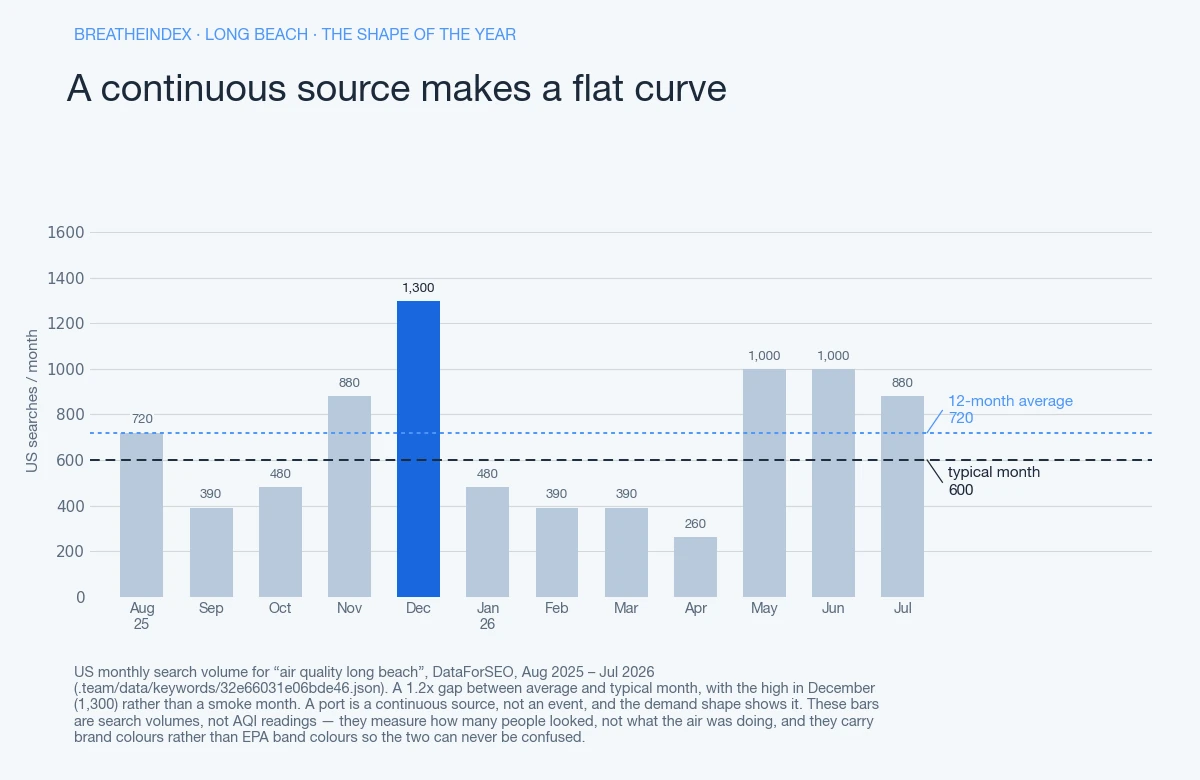
It pulls from the same hourly AQI feed as the number above. A running count tracks days above AQI 100 since we began counting. Most cities on this list show clear spikes: a fire month, an inversion stretch, then a quiet baseline. The air quality Long Beach reports runs flatter than that. Its main source doesn’t take a season off, so the shape here reads more like a steady hum than a sharp peak-and-trough.
Why is it hazy in Long Beach today?
Three explanations cover most hazy-but-moderate days here. Smoothing across recent hours can hold back one genuinely rough hour. Smoke can sit aloft, above whatever’s actually measuring ground level. Or the monitoring station stands in for a stretch of metro it isn’t really next to. That’s a real risk in Long Beach, where a city-centroid reading and a harbor reading can differ more than in most single-mechanism metros.
Long Beach also sits inside the same South Coast basin marine layer that traps pollution against the coastline further north. Los Angeles’s own page covers the basin mechanics in full: the mountain ring, the marine layer, the Santa Ana winds that occasionally scour it clean. None of that makes a hazy sky here fake — it means the number is one average, from one station, standing in for a stretch of coastline with a working port at the center of it. Port exhaust, basin geography, and an averaged reading breaks the causes down.
What is causing the bad air in Long Beach?
Together, the Port of Long Beach and the neighboring Port of Los Angeles are the two busiest container ports in the United States. That’s IQAir’s own research. Ships, trucks and cargo-handling equipment run on diesel most days of the year, making the port a continuous source, not an event. Unlike a wildfire month or a cold-air inversion, there’s rarely one bad week to point to here.
The same research credits the ports’ 2006 Clean Air Action Plan with cutting particulate matter (PM) from port operations by 87%. Nitrogen oxides are down 58% since it took effect. Even so, the two ports together still produce an estimated 100 tons of smog daily, with little further improvement measured since 2011. That gap — real progress, real ceiling — is why the verdict below has to work on an ordinary Tuesday, not just a bad one.
What makes the call different in Long Beach?
A reading taken at the Long Beach harbor and one taken at the city centroid can genuinely disagree. Port traffic and ship emissions sit heaviest right at the water. Go on an ordinary day. Short and unloaded: the short dog loop, errands instead of yard work near the port side of town. Don’t go once trimming isn’t enough.
On the EPA scale, everyone gets warned starting at 151, Unhealthy. 201 through 300, Very Unhealthy, is that same warning turned up, not a new group added to it. Past roughly 200 — harbor reading or centroid reading — the outing waits.
What AQI should you stay inside?
Personal thresholds here shift with which of the two readings — harbor or centroid — a person is actually breathing. An asthmatic runner logged 156 runs against AQI and drew the line at 60. Past it, “my lungs struggle regardless of how well I’ve trained,” even though EPA calls nothing under 100 unhealthy.
That log: 87% of runs under 50 went fine, 42% between 50 and 70, just 12% past 70. A r/Marathon_Training runner sets theirs far higher: “I’ll run in up to 110 because…error bars.” Parents this project has seen online land near 100.
Wildfire smoke pulls that whole table down about one EPA band, stacked on top of whatever the port and harbor traffic already contribute. 101–150 is the EPA’s orange band, Unhealthy for Sensitive Groups, attributed and not a verdict on any one reader.
California hasn’t put a number on this for schools or daycares, at least nothing this project can confirm. No other state has one in that material either — Washington and Minnesota come up only as individual centres. The two states people report a threshold from covers both.
Indoors, a Corsi-Rosenthal box or a portable HEPA purifier is the default — one community builder priced a 12x14 bedroom box at $130. A MERV-13 swap needs a static-pressure check from a licensed tech first; it isn’t automatic for a system near the harbor’s heavier particulate mix. Why a monitor beats a purifier as a first purchase sets out the order.
Why our number may not match what you are seeing and smelling
The mismatch runs in two directions here. A hazy sky with a moderate reading is usually smoothing across recent hours, or a station standing in for the wrong stretch of coastline. A clear, still day can still carry a bad number. Ground-level ozone and diesel particulate near the port don’t always announce themselves to the eye or nose the way visible smoke does.
Today’s reading for Long Beach comes from AirNow’s South Coastal LA reporting area, whose reference point sits about 3.7 miles from the metro centre. As of .
PM2.5 and PM10 both factor into the port reading. This is likely the sharpest station-distance case on this whole site: a monitor sited toward the city center can under-report the neighborhoods that sit right against the port complex, sometimes by a meaningful margin. Why a city-center monitor under-reports the port edge is documented in full.
What Long Beach looks like from across the basin
Los Angeles has its own folk indicator for a genuinely clear day: whether Catalina Island is visible from the Getty Center, up in the hills. During the 2020 lockdown, traffic was down across the whole basin. Hikers there reported something rarer — seeing all the way to Long Beach, not just Catalina.
Catalina from the Getty is the sight regulars already expect. Long Beach alongside it was the surprise, worth noting because the port here runs on the same continuous, non-seasonal schedule. An ordinarily hazy sightline down this stretch of coast may have less to do with weather than with a source that sits right at the harbor, working every day of the year.
The same basin, the same mechanism elsewhere
Irvine sits further inland in the same South Coast basin, catching the marine layer without the port traffic. The port-and-industrial-corridor mechanism itself isn’t unique to Southern California: Houston runs a similar refinery-and-ship-channel setup, and Oakland has its own version across the Bay.
Pittsburgh’s Allegheny valley traps industrial emissions the same way a coastal marine layer traps port diesel. Different geography, same lesson: a constant source needs a verdict that works on an ordinary day, not just a bad one.
Where this number sits
Of the 121 US metros reporting to us right now, Long Beach is number 32 and number 8 of the 12 we track in California. The pollutant driving it today is PM2.5.
Nearby metros we also measure, and what they read at the same hour:
- Anaheim, CA — 17 miles away, AQI 46
- Los Angeles, CA — 20 miles away, AQI 60
- Irvine, CA — 22 miles away, AQI 46
- Riverside, CA — 47 miles away, AQI 73
Where this reading comes from
AirNow’s South Coastal LA reporting area, about 3.7 miles from the metro centre.
What has air quality in Long Beach actually been?
1 of the 30 days we have recorded so far went above AQI 100.
| Date | Daily max AQI | EPA band | Hours read |
|---|---|---|---|
| 58 | Moderate | 23 | |
| 64 | Moderate | 23 | |
| 55 | Moderate | 23 | |
| 105 | Unhealthy for Sensitive Groups | 23 | |
| 46 | Good | 23 | |
| 62 | Moderate | 23 | |
| 61 | Moderate | 23 | |
| 54 | Moderate | 23 | |
| 53 | Moderate | 23 | |
| 51 | Moderate | 23 | |
| 46 | Good | 23 | |
| 55 | Moderate | 24 | |
| 51 | Moderate | 23 | |
| 58 | Moderate | 23 | |
| 62 | Moderate | 23 | |
| 68 | Moderate | 23 | |
| 95 | Moderate | 23 | |
| 62 | Moderate | 22 | |
| 76 | Moderate | 23 | |
| 68 | Moderate | 23 | |
| 63 | Moderate | 23 | |
| 68 | Moderate | 24 | |
| 63 | Moderate | 23 | |
| 54 | Moderate | 24 | |
| 61 | Moderate | 24 | |
| 60 | Moderate | 24 | |
| 62 | Moderate | 23 | |
| 74 | Moderate | 23 | |
| 61 | Moderate | 26 | |
| 55 | Moderate | 13 — partial day |
Questions about Long Beach
What is the air quality in Long Beach right now?
Which monitor does this number come from?
How does Long Beach compare with metros nearby?
Does this include pollen?
Put this number in context
Updated