
Right now: Houston is at 49, good.
Is the air safe to breathe in Houston today?
In Houston, BreatheCheck reads 49 as Go. The cutoffs: go below 101, keep it short and easy from 101 to 150, move it indoors above 150. These are our own thresholds, drawn on the EPA bands — EPA itself classifies 101–150 as Unhealthy for Sensitive Groups and does not tell you how long to stay out.
Go AQI 0–100
Normal outdoor plans. No change needed.
Short & unloaded AQI 101–150
A 20-minute dog walk, not a 2.5-hour run. Keep it brief and easy.
Don’t go AQI 151+
Move it indoors. Above 200 that becomes everyone, not just sensitive groups.
Above 200 this stops being a personal call: everyone indoors.
Duration and intensity are two separate dials
| Under 20 min | 20–60 min | Over an hour | |
|---|---|---|---|
| Easy | Go | Go | Go |
| Moderate | Go | Go | Go |
| Hard | Go | Go | Go |
Go Every combination lands the same way at this reading — a hard hour is no different from an easy twenty minutes. The two dials separate above 80.
Where people actually draw the line
All the thresholds people reported, and who reported them
- 60 Asthmatic runnerone runner’s own 156-run log
- 75–100 Daycare / schoolparents and staff in one r/toddlers thread, Aug 2025 — not a published rule
- 100 Parentcommunity-reported, escalating at 150 and 200
- 110 Runnercommunity-reported
If you’re staying in, filter the room you’re actually in
That color and number are today’s Houston read, nothing more. It decides the porch walk, the Ship Channel commute, or the kid’s soccer practice you’re weighing right now. BreatheCheck tracks the air quality Houston actually breathes since we began measuring here, not one headline figure. Skip refreshing it. Set a threshold and get told when an ozone day starts, rather than checking.
How does today compare with Houston’s record so far?
Since 16 August 2026 we have recorded 30 days for Houston. 11 went above AQI 100, and the highest daily maximum was 215, on 2 September 2026. The day-by-day record is further down.
One reading won’t tell you if today is ordinary or a spike. Our own record, further down this page, rebuilds the air quality Houston has seen since we began measuring here, from the same hourly AQI feed as the number above.
The page also carries a running count of days above AQI 100 since we began counting. IQAir, AccuWeather and aqicn, plus the Texas Commission on Environmental Quality’s own monitor grid, all show today’s number. None show the shape behind it, over time. A bad Tuesday that clears by Thursday still shows up here, instead of disappearing.
Why is it hazy in Houston today?
Three mechanisms usually explain it: the AQI averages 24 hours so a bad hour gets diluted, wildfire or industrial smoke can sit aloft above the ground-level monitor, or the nearest Texas Commission on Environmental Quality station sits miles from the hazy block. None of that makes the haze fake — it means the number is a one-day average from one location.
The AQI smooths recent hours together, weighted toward the latest, so a genuinely bad hour takes a few hours to register in full in the headline figure. Smoke can sit aloft, a few thousand feet up, above the ground-level monitor that’s actually breathing your street’s air — it might drift from a wildfire as far off as Canada, or from a nearer industrial release. The coastal plain side of the metro and the refinery corridor side can also read differently depending on which station is closest.
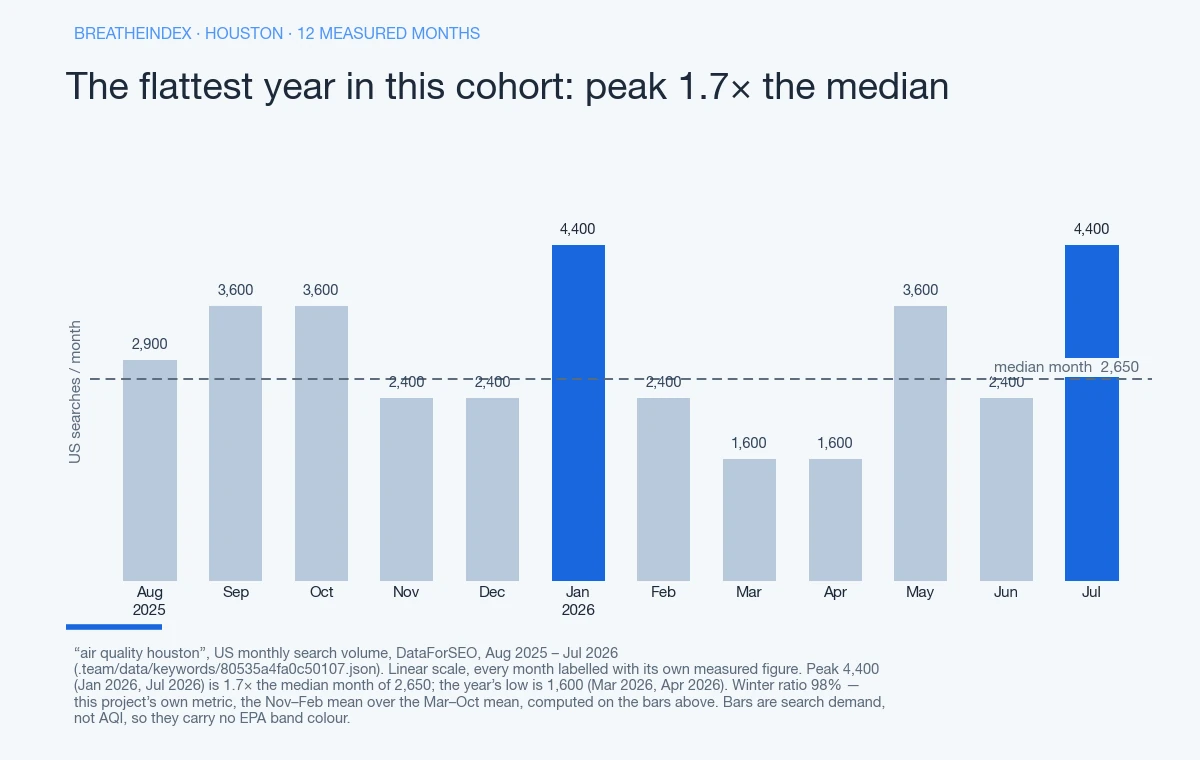
Houston also gets a haze source most ozone-dominant metros in this corpus don’t: Saharan dust. It’s carried across the Atlantic and the Gulf most summers. It shows up as coarse particulate matter (PM10) rather than the finer PM2.5 that wildfire smoke carries — a real, visible haze with a different chemical fingerprint from either smoke or ozone. Refinery plumes, ship-channel wind, sunlight-cooked ozone sets out the national version.
What is causing the bad air in Houston?
Ground-level ozone drives Houston’s air quality nearly year-round, not the wintertime smoke that defines northern and mountain metros. Gulf heat and sunlight cook vehicle and industrial exhaust into ozone, spring through fall. The American Lung Association’s 2019 report ranked Houston 9th nationally for worst ozone, a weighted average of 22.3 days a year exceeding federal standards.
This is a 2019 figure, not a live one — but it names the mechanism correctly.
A second, non-seasonal source sits on top of that baseline: the Houston Ship Channel and its petrochemical corridor. It’s one of the largest refining concentrations in the country. An Environmental Defense Fund estimate, published in 2020, put the Port of Houston’s own smog-forming pollution at roughly 4.1 tons a year. This project hasn’t independently verified that figure, and it excludes individual refineries along the Ship Channel. This corridor can spike fine particulate matter (PM2.5), sulfur dioxide or nitrogen dioxide on short notice. That’s unrelated to ozone season entirely — a flaring event, a shutdown, a unit upset. We haven’t found a specific, dated Houston flaring event described firsthand in the material reviewed here, so we’re not naming one. The corridor’s contribution is documented at the refinery-count and emissions-estimate level, not as an as-it-happened account.
The Houston-Galveston area’s own response to a bad forecast is an Ozone Action Day from the Texas Commission on Environmental Quality — a voluntary call to cut vehicle trips and refueling, not an enforced restriction. That’s the program in general terms; we haven’t sourced TCEQ’s own wording for it, so read the day’s actual call from TCEQ rather than from us.
What makes the call different in Houston?
Houston’s worst air runs on summer ozone, cooked by heat and traffic, with whatever the ship channel adds on a still day layered in. There’s no trapped valley here the way a mountain city gets one. Go on Good or Moderate air. Short and unloaded: a lap of the block instead of three.
Don’t go once the color turns red or worse — a Gulf-humid afternoon at that level isn’t safer for being flat instead of boxed in. EPA’s everyone-warning starts at 151, Unhealthy. 201 to 300, Very Unhealthy, escalates that same warning rather than adding a new group. Past roughly 200, the outing doesn’t happen, industrial source or not.
What AQI should you stay inside?
Nobody here agrees on one number. A runner on r/Marathon_Training: “I’ll run in up to 110 because…error bars.” An asthmatic runner puts it at a hard 60, from 156 logged runs against AQI. Past it, “my lungs struggle regardless of how well I’ve trained,” EPA’s own 100-unhealthy line notwithstanding. Their success rate drops from 87% to 42% to 12% across the under-50, 50–70, and above-70 bands. Parents land somewhere near 100.
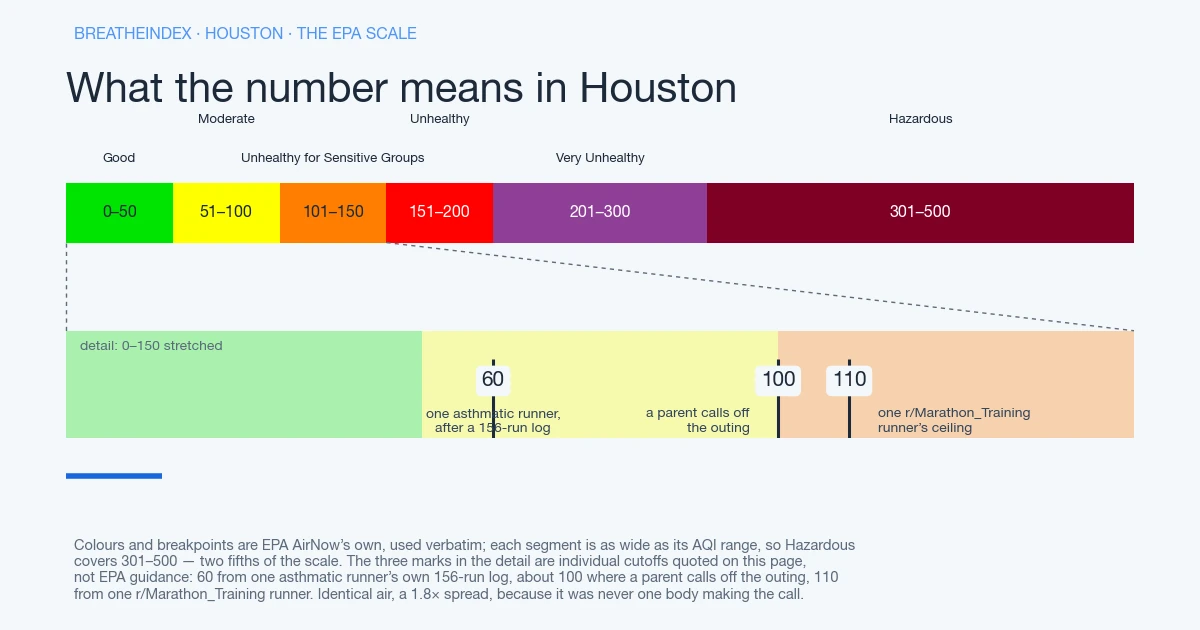
A Gulf-humidity ozone afternoon and a wildfire-smoke day pull that table down by different amounts. Smoke goes further — about one EPA band past whatever heat already added. In EPA’s scheme 101–150 is Unhealthy for Sensitive Groups, an attributed classification rather than a personal call.
No Texas rule sets a school or daycare AQI threshold, at least none this project can confirm. Nor does any other state; what circulates for Washington and Minnesota is a handful of first-hand accounts from single centres. Whether any state writes a daycare threshold down has both.
Go with a portable HEPA purifier, or build a Corsi-Rosenthal box — around $130 got one community member a 12x14 bedroom’s worth. A whole-house MERV-13 filter needs a licensed tech to check the system’s static pressure first, especially in humid-climate ductwork. The MERV question, answered without the sales pitch goes further.
Why our number may not match what you are seeing and smelling
The mismatch between Houston’s sky and its AQI number runs both directions. A hazy sky with a fine-reading number is usually 24-hour averaging, or smoke sitting aloft above street level. A clear, ordinary-looking day with a climbing number is ground-level ozone at work. Houston’s dominant pollutant most of the year is invisible and odorless. It peaks on the same hot, sunny, low-wind afternoons that look like perfect outdoor weather.
That’s exactly why the reading and the sky disagree most, on the days Houston looks its best.
Today’s reading for Houston comes from AirNow’s Houston-Galveston-Brazoria reporting area, whose reference point sits about 1.3 miles from the metro centre. As of .
A station miles from where you’re standing under-reports whichever side of the metro sits farthest from it. Often that’s the Ship Channel side, where industrial and residential air can read differently from what a downtown or west-side monitor shows. Why a downtown monitor and a Ship Channel monitor disagree covers that split.
Why Houston’s air quality runs on ozone, not inversion
Houston runs on ozone, not inversion. It never gets the cold-air-pool lid that traps pollution over Salt Lake City, Denver or Boise each winter. It’s too flat, too warm and too close to sea level for that lid to form. Its ozone instead builds through the warm months, roughly spring through fall, driven by heat and sunlight rather than a trapped, stagnant air mass.
AQI aggregates PM2.5 and ozone into one number. That’s why Denver’s number can look fine while the ozone is the problem. The same mechanism runs under Atlanta’s own ozone season and Phoenix’s summer ozone spikes, and under Los Angeles’s smog longest of all.
Houston’s own addition to that pattern is the port and petrochemical corridor along the Ship Channel. That’s a source class the ozone-only metros don’t share. Long Beach carries the same port-and-industrial mix, and so does Oakland, on its own stretch of bay. The air quality Houston reports is one number for a metro that runs a refinery corridor and a residential suburb at once. The AQI hands you a citywide average, not a reading for either one specifically.
Where this number sits
Of the 121 US metros reporting to us right now, Houston is number 33 and number 3 of the 5 we track in Texas. The pollutant driving it today is O3.
Nearby metros we also measure, and what they read at the same hour:
- Austin, TX — 146 miles away, AQI 52
- San Antonio, TX — 189 miles away, AQI 52
- Dallas, TX — 225 miles away, AQI 42
- Fort Worth, TX — 235 miles away, AQI 42
Where this reading comes from
AirNow’s Houston-Galveston-Brazoria reporting area, about 1.3 miles from the metro centre.
What has air quality in Houston actually been?
11 of the 30 days we have recorded so far went above AQI 100.
| Date | Daily max AQI | EPA band | Hours read |
|---|---|---|---|
| 73 | Moderate | 23 | |
| 55 | Moderate | 24 | |
| 57 | Moderate | 24 | |
| 75 | Moderate | 24 | |
| 97 | Moderate | 24 | |
| 67 | Moderate | 24 | |
| 80 | Moderate | 24 | |
| 97 | Moderate | 24 | |
| 74 | Moderate | 24 | |
| 72 | Moderate | 25 | |
| 74 | Moderate | 24 | |
| 73 | Moderate | 24 | |
| 215 | Very Unhealthy | 24 | |
| 212 | Very Unhealthy | 24 | |
| 213 | Very Unhealthy | 24 | |
| 151 | Unhealthy | 24 | |
| 201 | Very Unhealthy | 24 | |
| 101 | Unhealthy for Sensitive Groups | 24 | |
| 93 | Moderate | 24 | |
| 93 | Moderate | 24 | |
| 110 | Unhealthy for Sensitive Groups | 24 | |
| 79 | Moderate | 24 | |
| 101 | Unhealthy for Sensitive Groups | 24 | |
| 122 | Unhealthy for Sensitive Groups | 24 | |
| 97 | Moderate | 24 | |
| 78 | Moderate | 24 | |
| 64 | Moderate | 24 | |
| 147 | Unhealthy for Sensitive Groups | 24 | |
| 169 | Unhealthy | 27 | |
| 63 | Moderate | 13 — partial day |
Questions about Houston
What is the air quality in Houston right now?
Which monitor does this number come from?
How does Houston compare with metros nearby?
Does this include pollen?
Put this number in context
Updated