
Right now: Phoenix is at 66, moderate.
Is the air safe to breathe in Phoenix today?
In Phoenix, BreatheCheck reads 66 as Go. The cutoffs: go below 101, keep it short and easy from 101 to 150, move it indoors above 150. These are our own thresholds, drawn on the EPA bands — EPA itself classifies 101–150 as Unhealthy for Sensitive Groups and does not tell you how long to stay out.
Go AQI 0–100
Normal outdoor plans. No change needed.
Short & unloaded AQI 101–150
A 20-minute dog walk, not a 2.5-hour run. Keep it brief and easy.
Don’t go AQI 151+
Move it indoors. Above 200 that becomes everyone, not just sensitive groups.
Above 200 this stops being a personal call: everyone indoors.
Duration and intensity are two separate dials
| Under 20 min | 20–60 min | Over an hour | |
|---|---|---|---|
| Easy | Go | Go | Go |
| Moderate | Go | Go | Go |
| Hard | Go | Go | Go |
Go Every combination lands the same way at this reading — a hard hour is no different from an easy twenty minutes. The two dials separate above 80.
Where people actually draw the line
At 66, this reading is past Asthmatic runner 's line.
All the thresholds people reported, and who reported them
- 60 Asthmatic runnerone runner’s own 156-run log
- 75–100 Daycare / schoolparents and staff in one r/toddlers thread, Aug 2025 — not a published rule
- 100 Parentcommunity-reported, escalating at 150 and 200
- 110 Runnercommunity-reported
If you’re staying in, filter the room you’re actually in
That reading and color are today’s Phoenix call, nothing more. It decides the walk, the run, or the kid’s practice you’re weighing right now. BreatheCheck tracks the air quality Phoenix actually breathes since we began measuring here — not just the number sitting above. Skip refreshing it. Set your number and get an email when a haboob or an ozone day passes it.
How does today compare with Phoenix’s record so far?
Since 16 August 2026 we have recorded 30 days for Phoenix. 19 went above AQI 100, and the highest daily maximum was 478, on 30 August 2026. The day-by-day record is further down.
One reading won’t tell you if today is ordinary or a spike. Our own record, further down this page, rebuilds the air quality Phoenix has seen since we began measuring here, from the same hourly AQI feed as the number above.
The page also carries a running count of days above AQI 100 since we began counting. IQAir, AccuWeather, aqicn and Arizona’s own monitor grid show today’s number and nothing behind it — no shape over time. A single dust-storm day that clears by the next morning still shows up here, instead of disappearing.
Why is it hazy in Phoenix today?
Three things usually explain a sky that looks worse than the number reads. The AQI smooths recent hours together, weighted toward the latest, so one bad hour of blowing dust takes a few hours to show up in full. Haboob dust is also patchy — it can wall off one part of the Valley and miss another close by. A station on the missed side reads calmer than a nearby street.
One resident watched “the weather radar” as a storm closed in (29 upvotes). Another, a few miles off, said “everything is going right around us” instead (11 upvotes). None of that makes the haze fake. It means the reading is one day, averaged, at one place. Dust you can see and ozone you can’t covers every way the number and your senses split.
What is causing the bad air in Phoenix?
Two different sources feed the same number, on different calendars. The haboob is the loud one: a wall of dust kicked up by outflow winds from a collapsing thunderstorm, common during Arizona’s monsoon. That’s coarse particulate matter (PM10), not the fine PM2.5 that dominates wildfire smoke. Phoenix’s other pollutant, ozone, runs closer to year-round.
A Reddit thread explained: “‘monsoon’ refers to the broader SEASON in summertime characterized by moisture, NOT a discrete thunderstorm and/or dust storm” (66 upvotes). A haboob is the single dust event inside that season. The city’s own environmental office states plainly that “the primary air quality concerns in Phoenix are ozone and particulate pollution (dust and smoke).” One state forecast paired both concerns in one line: “ozone levels are expected to increase, and evening dust chances will increase as well.” The American Lung Association’s 2025 “State of the Air” report put the Phoenix metro fourth-worst in the country for ozone pollution. That ranking has nothing to do with dust.
What makes the call different in Phoenix?
A Phoenix haboob doesn’t cover the Valley evenly. One resident watched a storm close in on the radar; a few miles off, someone else reported clear skies the whole time. The reading depends on which side of that dust wall the monitor sits. Go on ordinary air. Short and unloaded: errands instead of yard work. Don’t go once dust pushes the color into red.
EPA’s everyone-warning starts at 151, Unhealthy, and 201 to 300, Very Unhealthy, is that same warning at a more serious level, not a new group. Past roughly 200, dust wall or clear sky nearby, the plan moves indoors.
What AQI should you stay inside?
Parents this project has seen online tend to call off a group outing around 100. A runner on r/Marathon_Training pushes much further: “I’ll run in up to 110 because…error bars.” An asthmatic runner logged 156 runs against AQI and drew a much tighter line, 60.
“my lungs struggle regardless of how well I’ve trained,” despite EPA calling nothing under 100 unhealthy. Success fell from 87% under 50 to 42% between 50 and 70 to 12% past 70.
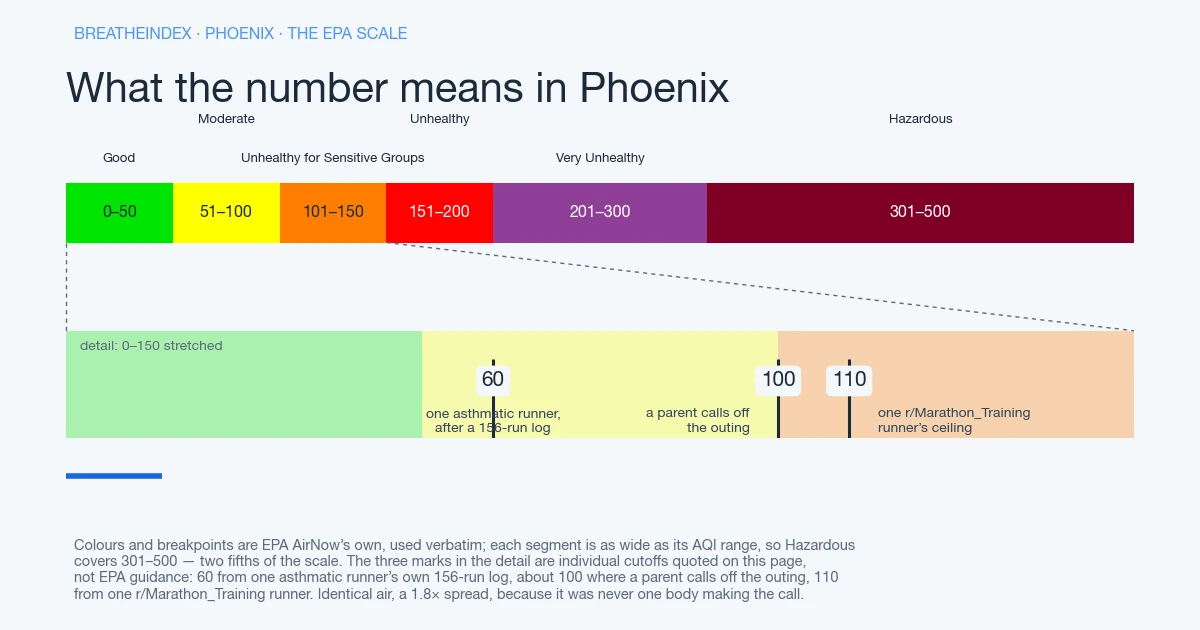
Dust irritates on contact; smoke works deeper. A monsoon haboob and a summer wildfire event don’t move that threshold table the same distance — smoke pulls further, roughly one EPA band beyond dust alone. That 101–150 window is EPA’s Unhealthy for Sensitive Groups band — attributed, not a judgment on any one reader.
Arizona hasn’t put a number on this for schools or daycares, nothing this project has confirmed either way. The Washington and Minnesota figures in circulation are individual centres’ lines, reported by the people who use them, not state rules. Whether any state names an AQI cutoff for daycares has both.
The indoor default is a portable HEPA purifier, or a Corsi-Rosenthal box — one community member’s 12x14 bedroom build ran about $130. Hold off on a whole-house MERV-13 swap until a licensed tech has confirmed the system can handle a dust-heavy climate’s static pressure. What helps indoors once the dust is up covers it.
Why our number may not match what you are seeing and smelling
The hazy-but-fine-reading version sits above; this runs in reverse — normal sky, no smell, bad number anyway. Ground-level ozone is invisible and odorless, so a clear, warm afternoon can still carry a reading a monitor calls unhealthy.
There’s a third case neither direction covers, and locally it worries residents more than the AQI number does: Valley Fever. The fungus lives in Arizona topsoil, riding into the air on wind and dust, independent of the PM2.5 or ozone readings behind today’s AQI. The number does not measure fungal spores at any level — our own methodology page states that plainly. One r/phoenix thread on the risk drew mixed answers: “Valley Fever is in the top layer of soil, it is carried by the wind… I wouldn’t worry about it too much, but staying inside during dusty days is a good idea” (194 upvotes). Against that, lung nodules took two years to calcify (80 upvotes), and a skeptic said: “Been in Phoenix for 26 years. Never had a problem with it that I am aware of.” (9 upvotes). We’re not resolving that disagreement. Arizona’s Department of Health Services publishes its own guidance on dust storms, air quality and Valley Fever. That’s the source to check, not a forum thread or this page.
Today’s reading for Phoenix comes from AirNow’s Phoenix reporting area, whose reference point sits about 6.4 miles from the metro centre. As of .
A distant station under-reports whichever side of the metro sits farthest from it. That’s worst during a haboob the station on the wrong side of town never saw. Why a haboob can miss the station entirely explains the gap.
Why Phoenix’s air quality shifts through the year
The air quality Phoenix sees doesn’t peak once — dust and ozone trade off. The haboob season rides Arizona’s monsoon, broadly June through September. Outflow winds can wall one part of the Valley in dust and leave the rest clear. Ozone runs on a longer fuse, building through the hottest stretches of the year rather than any single storm.
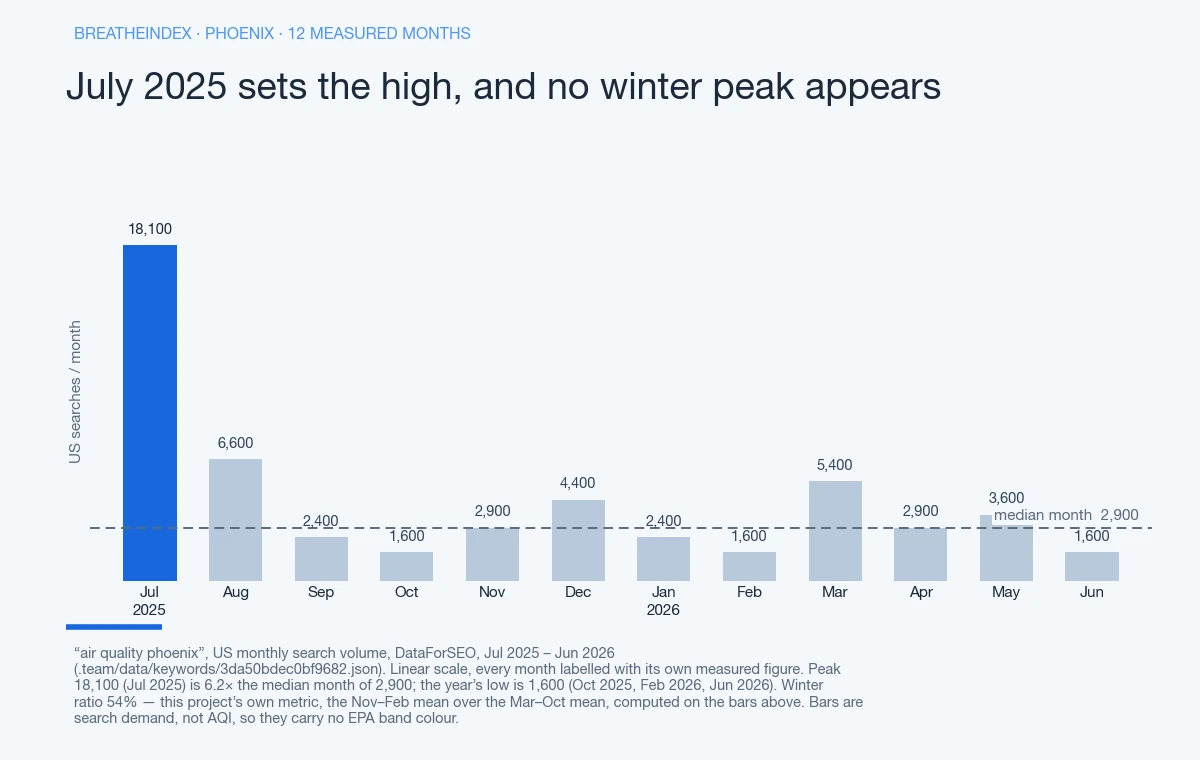
The city’s own environmental office names both as its “primary air quality concerns,” not one or the other. A separate winter peak for Phoenix hasn’t been verified in this project’s own data, so none is asserted here. This project’s own search-interest window for Phoenix runs Jul 2025 through Jun 2026. It has no July 2026 reading at all — the month that dominates the chart for several sibling metros in this cluster. That’s a gap in what’s been pulled, not a measured calm month; it says nothing about whether Phoenix’s own air held steady in July 2026.
The dust-storm pattern isn’t unique to the Valley, either. Tucson sits in the same Desert Southwest haboob and monsoon airshed, and so does Albuquerque, further up the same corridor. The ozone half of the story runs on a different map entirely. Denver’s ozone runs on the same sunlight-and-exhaust mechanism, and so do Houston’s refinery-fed version, Atlanta’s summer season and Los Angeles’s, the longest-running case of it.
Where this number sits
Of the 121 US metros reporting to us right now, Phoenix is number 7 and the highest of the 3 we track in Arizona. The pollutant driving it today is PM10.
Nearby metros we also measure, and what they read at the same hour:
- Scottsdale, AZ — 11 miles away, AQI 37
- Tucson, AZ — 106 miles away, AQI 44
- Las Vegas, NV — 256 miles away, AQI 51
- San Diego, CA — 299 miles away, AQI 61
Where this reading comes from
AirNow’s Phoenix reporting area, about 6.4 miles from the metro centre.
What has air quality in Phoenix actually been?
19 of the 30 days we have recorded so far went above AQI 100.
| Date | Daily max AQI | EPA band | Hours read |
|---|---|---|---|
| 106 | Unhealthy for Sensitive Groups | 23 | |
| 74 | Moderate | 24 | |
| 121 | Unhealthy for Sensitive Groups | 21 | |
| 79 | Moderate | 24 | |
| 108 | Unhealthy for Sensitive Groups | 24 | |
| 80 | Moderate | 24 | |
| 111 | Unhealthy for Sensitive Groups | 24 | |
| 108 | Unhealthy for Sensitive Groups | 24 | |
| 47 | Good | 24 | |
| 54 | Moderate | 25 | |
| 74 | Moderate | 24 | |
| 94 | Moderate | 24 | |
| 93 | Moderate | 24 | |
| 71 | Moderate | 24 | |
| 70 | Moderate | 19 | |
| 478 | Hazardous | 23 | |
| 105 | Unhealthy for Sensitive Groups | 24 | |
| 271 | Very Unhealthy | 23 | |
| 129 | Unhealthy for Sensitive Groups | 24 | |
| 160 | Unhealthy | 24 | |
| 122 | Unhealthy for Sensitive Groups | 24 | |
| 300 | Very Unhealthy | 21 | |
| 112 | Unhealthy for Sensitive Groups | 24 | |
| 176 | Unhealthy | 24 | |
| 126 | Unhealthy for Sensitive Groups | 24 | |
| 108 | Unhealthy for Sensitive Groups | 19 | |
| 133 | Unhealthy for Sensitive Groups | 24 | |
| 136 | Unhealthy for Sensitive Groups | 24 | |
| 105 | Unhealthy for Sensitive Groups | 27 | |
| 74 | Moderate | 13 — partial day |
Questions about Phoenix
What is the air quality in Phoenix right now?
Which monitor does this number come from?
How does Phoenix compare with metros nearby?
Does this include pollen?
Put this number in context
Updated
This page has been corrected, most recently on — the Phoenix history counted the hours right after an instrument fault as real readings. See the correction log.