
Right now: Madison is at 31, good.
Is the air safe to breathe in Madison today?
In Madison, BreatheCheck reads 31 as Go. The cutoffs: go below 101, keep it short and easy from 101 to 150, move it indoors above 150. These are our own thresholds, drawn on the EPA bands — EPA itself classifies 101–150 as Unhealthy for Sensitive Groups and does not tell you how long to stay out.
Go AQI 0–100
Normal outdoor plans. No change needed.
Short & unloaded AQI 101–150
A 20-minute dog walk, not a 2.5-hour run. Keep it brief and easy.
Don’t go AQI 151+
Move it indoors. Above 200 that becomes everyone, not just sensitive groups.
Above 200 this stops being a personal call: everyone indoors.
Duration and intensity are two separate dials
| Under 20 min | 20–60 min | Over an hour | |
|---|---|---|---|
| Easy | Go | Go | Go |
| Moderate | Go | Go | Go |
| Hard | Go | Go | Go |
Go Every combination lands the same way at this reading — a hard hour is no different from an easy twenty minutes. The two dials separate above 80.
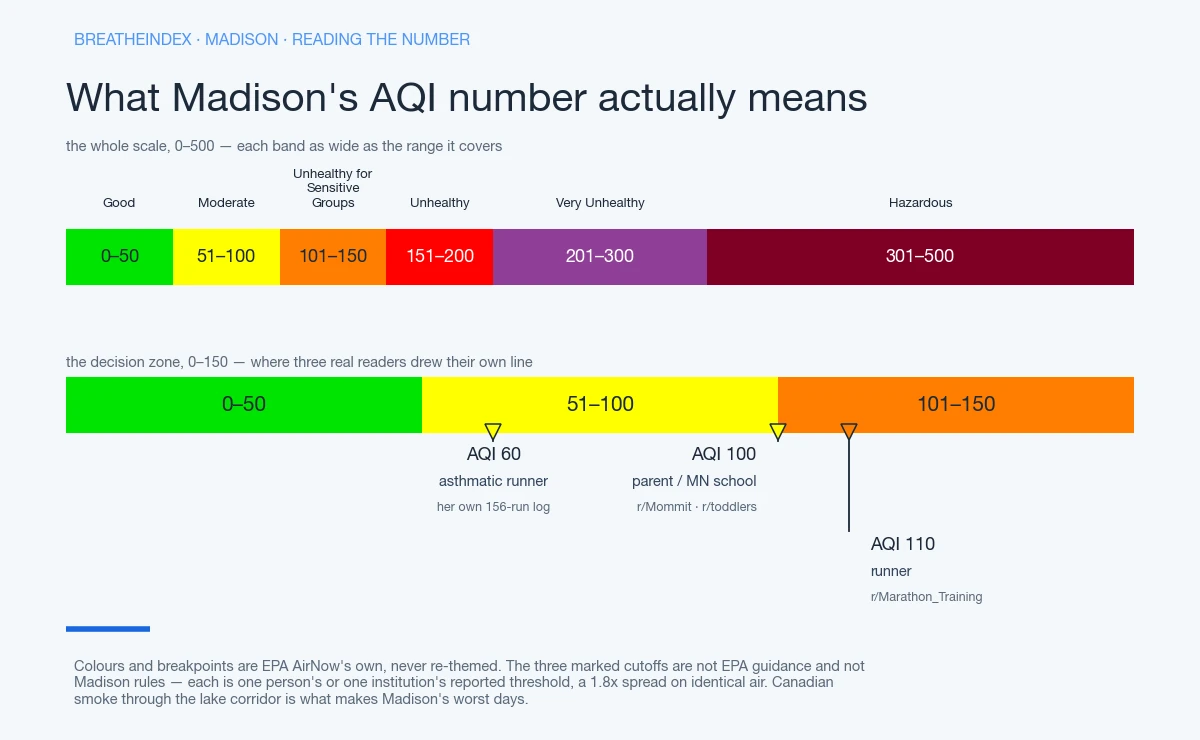
Where people actually draw the line
All the thresholds people reported, and who reported them
- 60 Asthmatic runnerone runner’s own 156-run log
- 75–100 Daycare / schoolparents and staff in one r/toddlers thread, Aug 2025 — not a published rule
- 100 Parentcommunity-reported, escalating at 150 and 200
- 110 Runnercommunity-reported
If you’re staying in, filter the room you’re actually in
That color and that number are today’s read on Madison air quality. Decide by the color first, the number second. The actual question underneath it is smaller: the isthmus bike path, soccer practice, whether tonight’s windows stay open. BreatheCheck tracks the air quality Madison has actually breathed since we began measuring here, not just the single figure sitting above. Set your own number and an email arrives when a plume pushes past it.
Madison’s typical month vs. its worst one
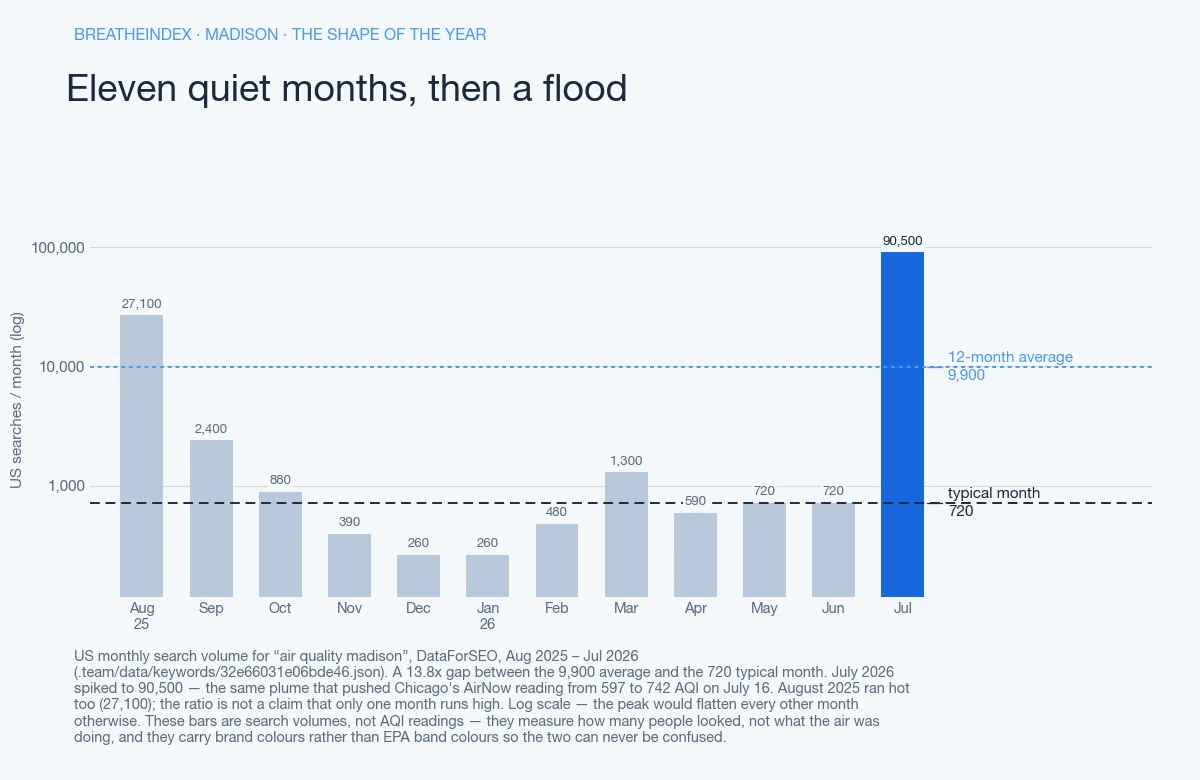
Search interest for “air quality madison” averages 9,900 a month across the trailing year. But the typical month runs only 720. One month, July 2026, spiked to 90,500 — the same Canadian smoke plume that pushed Chicago’s own AirNow reading from 597 to 742 AQI between mid-afternoon and late evening on July 16.
The 13.8x gap between that average and that typical month sits close to Milwaukee’s 15.1x. Both are driven by a wildfire-season flood, not a steady year-round baseline. This page rebuilds the air quality Madison actually breathed since we began measuring here, from the same hourly feed as the reading above. It also carries a running count of days above AQI 100 since we began counting — the shape IQAir, AccuWeather and Wisconsin’s own monitor grid never show, because none of them track more than today’s single number.
Since 16 August 2026 we have recorded 30 days for Madison. 0 went above AQI 100, and the highest daily maximum was 82, on 23 August 2026. The day-by-day record is further down.
Why is it hazy in Madison today?
Madison sits on a flat isthmus between two lakes, with none of the mountain walls that trap smog in a basin city. Most days the wind clears the air straight through. The exception is a Canadian wildfire plume, which ignores topography and can blanket the whole Upper Midwest corridor at once. Three things can also make the sky look worse than the reading: 24-hour averaging, smoke sitting aloft, or a distant station.
Wisconsin sits in the Upper Midwest lake corridor alongside Chicago, Milwaukee and Minneapolis. The AQI’s smoothing across recent hours holds back a bad afternoon across the day’s twenty calmer hours; smoke from a distant fire can sit aloft, thousands of feet up, above the monitor doing the measuring; or the nearest working station sits miles from wherever you actually are in the metro. None of that makes a hazy sky fake, or a clear one trustworthy — one number averages one location, not your block. A drifting plume and a number that lags it goes through the general case.
What is causing the bad air in Madison?
Two mechanisms trade off through a Madison year. Ground-level ozone builds on hot, still summer afternoons, invisible and odorless. PM2.5 dominates the rest of the year, from traffic and wood smoke. A Canadian wildfire plume can override both readings within hours. That’s the wildcard behind Madison’s own 13.8x average-to-typical-month gap, where a single smoke week can outweigh eleven ordinary ones.
The FAQ below carries today’s live read on which pollutant is actually driving the number.
What makes the call different in Madison?
Madison sits on a flat isthmus between two lakes, where wind usually clears the air within a day. The exception is a Canadian wildfire plume, which ignores flat terrain and can blanket the whole Upper Midwest corridor at once. Go on a normal reading. Short and unloaded: mowing half the lawn instead of the whole yard. Don’t go once a plume pushes the color past red.
EPA opens its everyone-warning at 151, Unhealthy. It treats 201 to 300, Very Unhealthy, as that same warning at a more serious stage, not a separate group. Past roughly 200, flat terrain or not, the plan moves indoors.
What AQI should you stay inside?
Wisconsin sets no air-quality threshold for schools or daycares — a structural gap, not an oversight. Licensing regulations require outdoor time and never mention air quality, so a provider that keeps the outdoor schedule during smoke isn’t violating any rule.
One commenter worked in Wisconsin schools and daycares for close to a decade. On r/toddlers, they laid out the mechanic: “I don’t think there’s anything in the state licensing regulations about air quality. However, the licensing regulations are very clear about children being given outside time.” A provider that keeps to the outdoor-time mandate, they added, “can’t be accused of a licensing violation” — air quality never enters the paperwork.
Minnesota, one state over, draws a real line: a parent there put it at 100, “because children are sensitive groups.” Washington locks a daycare cutoff at 80. Wisconsin has neither. Wisconsin’s licensing rule, and what it stops short of saying covers all three.
Adults here set their own numbers too, and they don’t agree with each other. On r/Marathon_Training, one runner wrote: “I’ll run in up to 110 because…error bars.” One asthmatic runner logged 156 runs against AQI and set a cutoff at 60. Past it, “my lungs struggle regardless of how well I’ve trained,” even though EPA calls nothing under 100 unhealthy. That log: 87% of runs under AQI 50 went fine, 42% between 50 and 70, just 12% above 70. Wildfire smoke — the same Canadian plume that overrides Madison’s usually-clearing wind — pulls that whole table down roughly one EPA band.
Indoors, default to a portable HEPA purifier or a Corsi-Rosenthal box. One builder priced a 12x14 bedroom’s worth at around $130. Skip the whole-house MERV-13 swap unless a licensed tech has checked the system’s static pressure first. What a Corsi-Rosenthal box does that a filter swap doesn’t has the detail.
Why our number may not match what you are seeing and smelling
The mismatch runs in both directions here, and the second one catches people off guard. A clear sky with a bad number is usually ground-level ozone, Madison’s dominant summer pollutant. It’s invisible and odorless, with no way to smell a safe read. A hazy-looking sky with a calm official number is usually 24-hour averaging, or smoke sitting aloft above the monitor.
Neither direction means the number is wrong. It means the number and your senses are reading different things.
Today’s reading for Madison comes from AirNow’s Madison Area reporting area, whose reference point sits about 0.9 miles from the metro centre. As of .
A station miles off under-reports whichever side of the metro sits farthest from it. What sits behind this number, and where it gets thin is set out plainly.
Where this number sits
Of the 121 US metros reporting to us right now, Madison is number 87 and number 2 of the 2 we track in Wisconsin. The pollutant driving it today is O3.
Nearby metros we also measure, and what they read at the same hour:
- Milwaukee, WI — 75 miles away, AQI 38
- Chicago, IL — 122 miles away, AQI 30
- Cedar Rapids, IA — 136 miles away, AQI 19
- Peoria, IL — 165 miles away, AQI 31
Where this reading comes from
AirNow’s Madison Area reporting area, about 0.9 miles from the metro centre.
What has air quality in Madison actually been?
0 of the 30 days we have recorded so far went above AQI 100.
| Date | Daily max AQI | EPA band | Hours read |
|---|---|---|---|
| 31 | Good | 23 | |
| 34 | Good | 23 | |
| 40 | Good | 24 | |
| 41 | Good | 23 | |
| 40 | Good | 24 | |
| 43 | Good | 24 | |
| 41 | Good | 24 | |
| 49 | Good | 23 | |
| 42 | Good | 23 | |
| 47 | Good | 23 | |
| 52 | Moderate | 24 | |
| 53 | Moderate | 24 | |
| 55 | Moderate | 24 | |
| 57 | Moderate | 23 | |
| 55 | Moderate | 23 | |
| 54 | Moderate | 23 | |
| 62 | Moderate | 24 | |
| 62 | Moderate | 23 | |
| 58 | Moderate | 23 | |
| 54 | Moderate | 23 | |
| 46 | Good | 23 | |
| 52 | Moderate | 24 | |
| 82 | Moderate | 23 | |
| 53 | Moderate | 24 | |
| 60 | Moderate | 24 | |
| 55 | Moderate | 24 | |
| 37 | Good | 23 | |
| 35 | Good | 24 | |
| 32 | Good | 27 | |
| 37 | Good | 13 — partial day |
Questions about Madison
What is the air quality in Madison right now?
Which monitor does this number come from?
How does Madison compare with metros nearby?
Does this include pollen?
Put this number in context
Updated