
Right now: Chicago is at 30, good. The source is wildfire smoke, which reads about one band worse than traffic exhaust at the same number.
Is the air safe to breathe in Chicago today?
In Chicago, BreatheCheck reads 30 as Go. The cutoffs: go below 101, keep it short and easy from 101 to 150, move it indoors above 150. These are our own thresholds, drawn on the EPA bands — EPA itself classifies 101–150 as Unhealthy for Sensitive Groups and does not tell you how long to stay out.
Go AQI 0–100
Normal outdoor plans. No change needed.
Short & unloaded AQI 101–150
A 20-minute dog walk, not a 2.5-hour run. Keep it brief and easy.
Don’t go AQI 151+
Move it indoors. Above 200 that becomes everyone, not just sensitive groups.
Above 200 this stops being a personal call: everyone indoors.
Duration and intensity are two separate dials
| Under 20 min | 20–60 min | Over an hour | |
|---|---|---|---|
| Easy | Go | Go | Go |
| Moderate | Go | Go | Go |
| Hard | Go | Go | Go |
Go Every combination lands the same way at this reading — a hard hour is no different from an easy twenty minutes. The two dials separate above 80.
Where people actually draw the line
All the thresholds people reported, and who reported them
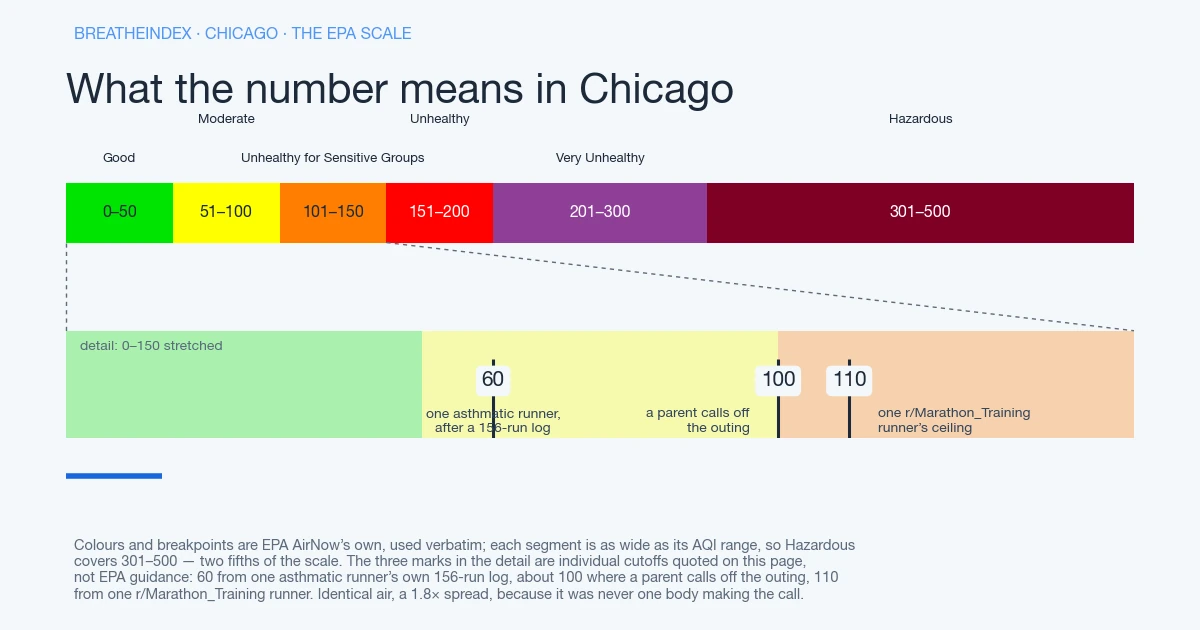
- 60 Asthmatic runnerone runner’s own 156-run log
- 75–100 Daycare / schoolparents and staff in one r/toddlers thread, Aug 2025 — not a published rule
- 100 Parentcommunity-reported, escalating at 150 and 200
- 110 Runnercommunity-reported
Wildfire smoke reads about one band worse than traffic exhaust at the same number. Several runners and asthmatics independently drop their cutoff when the source is smoke.
If you’re staying in, filter the room you’re actually in
That color and that number are today’s read on air quality in Chicago. What it settles is simpler than it looks: go, shorten it, or stay in. That’s the call about the lakefront run, the dog walk, or the kid’s recess you opened this page to make. BreatheCheck tracks the air quality Chicago breathes day by day, not one number that resets on refresh. Set your own line and hear about it when a plume crosses it instead.
How does today compare with Chicago’s record so far?
Since 16 August 2026 we have recorded 30 days for Chicago. 3 went above AQI 100, and the highest daily maximum was 126, on 5 September 2026. The day-by-day record is further down.
One reading tells you nothing about the shape behind it. This tracks air quality Chicago actually breathed since we began measuring here, built from the same hourly AQI feed as the number above.
The page also keeps a running count of days above AQI 100 since we began counting. IQAir, AccuWeather, aqicn and the Illinois EPA’s own state grid each hand you today’s number and nothing behind it. A bad Tuesday quietly disappears by Thursday. It doesn’t disappear here.
Why is it hazy in Chicago today?
Three things are usually behind a sky that looks worse than the number reads. The AQI smooths recent hours together, weighted toward the latest, so one bad hour takes a few hours to reach the headline figure in full. The haze can be smoke sitting a few thousand feet up, above the ground monitor doing the reading. Or the reading comes from a station some miles from wherever a reader is standing.
This project hasn’t confirmed which one, or how far off it sits. None of that makes it fake. Lake Michigan adds its own mechanism: an onshore lake breeze traps ozone and fine particles along the lakefront corridor. The shoreline reads worse than a suburb ten miles inland as a result. A Canadian plume, a lake breeze, an averaging window breaks each one down.
What is causing the bad air in Chicago?
Two pollutants trade off as Chicago’s dominant cause. Ground-level ozone forms when summer sun cooks exhaust, peaking on hot, still afternoons — invisible and odorless. PM2.5 (fine particulate matter) builds from traffic, industry and wood burning, trapped close to the ground by a Lake Michigan inversion on a stagnant day. Increasingly, a third cause overwhelms both: wildfire smoke carried hundreds of miles from Canada.
AccuWeather’s pollutant table never says which one is today’s driver; a dry, windy stretch can lift the coarser PM10 off streets instead of PM2.5 dominating. That wildfire smoke can push the combined number past either pollutant’s normal range within hours. The American Lung Association’s 2025 State of the Air report ranked Chicago-Naperville 15th worst nationally for ozone and 13th worst for particle pollution. Cook County posted F grades on both, with 20.3 unhealthy ozone days per year.
What makes the call different in Chicago?
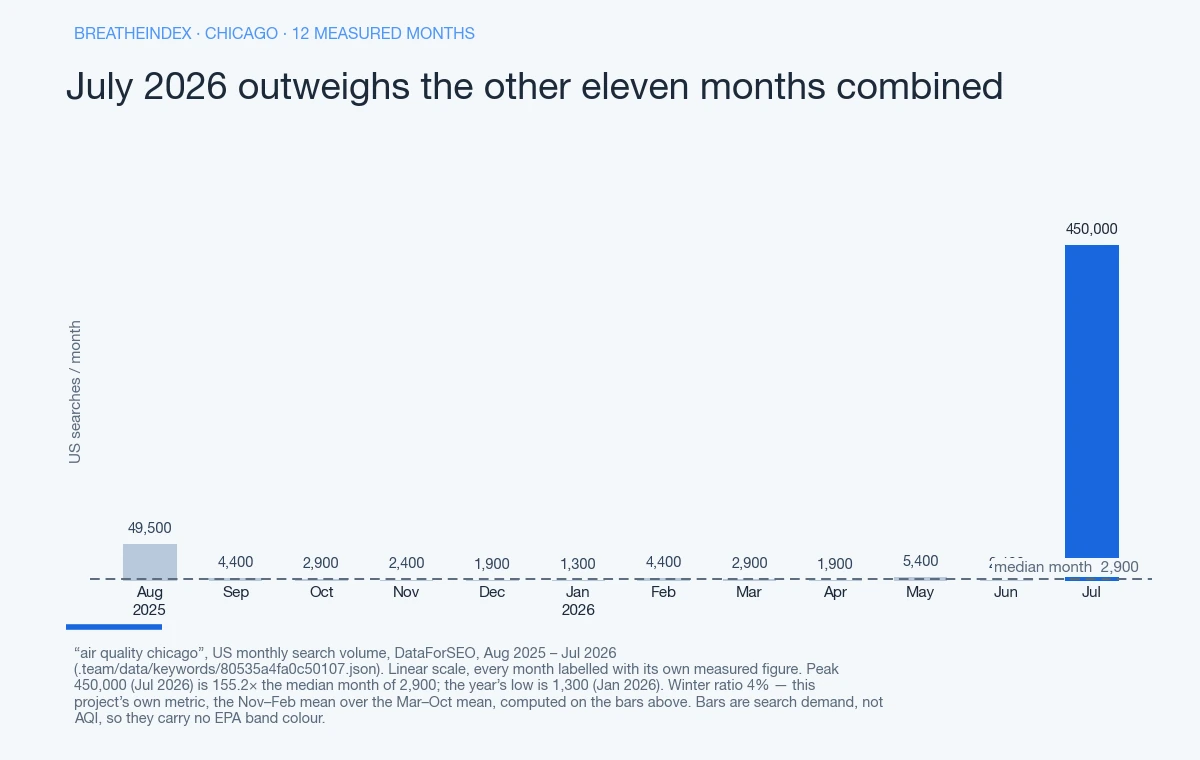
Chicago’s bad-air days used to mean a hot, still afternoon with the lake breeze holding ozone along the shore. Wildfire smoke from Canada is now a second source layered on top of that old pattern. Either one narrows to three calls. Go, unchanged, on Good or Moderate air. Short and unloaded — the treadmill instead of the lakefront trail — in the middle range. Don’t go past that.
On EPA’s scale, everyone is first warned at 151, Unhealthy. 201 to 300, Very Unhealthy, is that same warning escalated, not a new group added. Above roughly 200, the decision is made for you.
What AQI should you stay inside?
A runner, an asthmatic and a parent don’t share one cutoff, and none of the three matches the EPA’s single sensitive-groups line. “I’ll run in up to 110 because…error bars,” one r/Marathon_Training runner wrote. An asthmatic runner logged 156 runs against AQI and found their limit lower, at 60.
“my lungs struggle regardless of how well I’ve trained,” though EPA calls nothing under 100 unhealthy. Their numbers back it up: 87% of runs under 50 went fine, 42% between 50 and 70, just 12% past 70. Parents online tend to land near 100.
Illinois has no published daycare or school AQI cutoff in what this project has reviewed. No other state has one either; the Washington and Minnesota numbers that circulate are individual accounts of single centres, not state rules. What Illinois doesn’t publish, and what other states don’t either covers it.
Wildfire smoke, newly common here, pulls that whole table down about one EPA band — a different mechanism from the lake-breeze ozone Chicago is used to. The agency’s own label for that range is 101–150, Unhealthy for Sensitive Groups — a classification, not a diagnosis. Indoors, default to a portable HEPA purifier or a Corsi-Rosenthal box; one community builder priced a 12x14 bedroom version at $130. Skip the whole-house MERV-13 swap unless a licensed tech has already checked the system’s static pressure. Why indoor PM2.5 climbs in winter specifically picks it up from there.
Why our number may not match what you are seeing and smelling
This cuts both directions, and the second is the trap fewer people expect.
Direction one: the sky looks clear, nothing smells off, and the number is bad anyway. Ground-level ozone, Chicago’s dominant summer pollutant, is invisible and odorless. As one commenter put it: “spreading awareness about ozone is tough because it’s mostly invisible and odorless… telling people they’re breathing in a toxic invisible gas is a sure way to kill the vibe. But it must be done.” A clear sky isn’t the same test as a monitor.
Direction two: the sky is hazy, you can smell it, and the number stays low — the same averaging-and-distance problem, at Chicago’s scale. A station some distance from where you’re standing under-reports whichever side of the metro sits farthest from it. This project hasn’t confirmed which station, or how far off it sits. Chicago runs its own check on that gap: Open Air Chicago, roughly 280 community sensors run by Chicago’s health department with UIC’s School of Public Health, reading PM2.5 and NO2 neighborhood by neighborhood.
Today’s reading for Chicago comes from AirNow’s Chicago reporting area, whose reference point sits about 3.5 miles from the metro centre. As of .
It’s narrower than the citywide network above. How this number gets built, and where it goes soft has the mechanics.
Why Chicago’s smoke problem isn’t a season — it’s new
Every summer now stress-tests the air quality Chicago breathes. Calling it a season undersells three summers running, each measurably worse than the last — Chicagoans said so themselves.
June 2023: Canadian wildfire smoke pushed Chicago’s AQI past 160 — unhealthy for everyone, not only sensitive groups. It was the first time many longtime residents recalled smelling smoke from a fire that far away. By July 2025 the pattern had a name, but not the one you’d expect. “I’ve been here for decades and it seems like we’ve had more hazy days due to Canada in the past year than the prior ten combined” (306 upvotes). “Of my 25 years in the Chicago area, I don’t remember ever experiencing wildfire smoke like this prior to the last few years” (234 upvotes). A third put a full lifetime on it: “I have lived in Chicago all my 65 years of life. I have never smelled smoke from Canada until last summer!!!” (90 upvotes).
July 16, 2026 broke the pattern’s own record. A WGN headline, shared to r/chicago (1,505 upvotes), read “Chicago records worst air quality in its history.” The top reply, 901 upvotes: “missing ‘so far’ at the end.” Others noted the city’s own recordkeeping starts October 11, 1871, after the Great Chicago Fire. “Worst in history” really means “worst since a fire destroyed the prior records.” One Chicagoan tracked AirNow’s number climbing that afternoon, in a post that reached 609 upvotes. 597 AQI at 3:45 p.m., 701 by 4:30, 742 by 9:30 that night. A reading of 938 (an IQAir figure, not AirNow’s) came in from Northbrook, a suburb north of the city. The EPA’s AQI scale is defined only up to 500; there’s no color band above it. That 500 ceiling is very likely EPA’s own design choice, not a hardware limit — this project hasn’t sourced an EPA statement confirming it. A chart capped at 500 while the pollutant concentration keeps climbing doesn’t mean the air got safer. Presumably the underlying pollutant math keeps running past 500 instead of the display capping there — though this project hasn’t sourced that mechanism from IQAir either. AirNow’s own number for the same air, same day, would most likely have simply read 500. None of the sites checked for this project mention the ceiling at all.
Three summers, one direction: worse. Chicago isn’t alone on the mechanism behind it: Milwaukee sits in the same lake corridor, with Minneapolis typically catching the plume first and Madison a little further inland. The same plume kept moving east and south — New York took it at record strength, while Pittsburgh held it in the river valleys and St. Louis sits at the far end of that path. Calling it “smoke season” again would flatten three worsening years into one shrug.
Where this number sits
Of the 121 US metros reporting to us right now, Chicago is number 92 and number 2 of the 2 we track in Illinois. The pollutant driving it today is O3.
Nearby metros we also measure, and what they read at the same hour:
- Milwaukee, WI — 81 miles away, AQI 38
- Madison, WI — 122 miles away, AQI 31
- Grand Rapids, MI — 125 miles away, AQI 38
- Peoria, IL — 131 miles away, AQI 31
Where this reading comes from
AirNow’s Chicago reporting area, about 3.5 miles from the metro centre.
What has air quality in Chicago actually been?
3 of the 30 days we have recorded so far went above AQI 100.
| Date | Daily max AQI | EPA band | Hours read |
|---|---|---|---|
| 54 | Moderate | 23 | |
| 51 | Moderate | 24 | |
| 54 | Moderate | 24 | |
| 54 | Moderate | 24 | |
| 39 | Good | 24 | |
| 80 | Moderate | 24 | |
| 80 | Moderate | 24 | |
| 47 | Good | 24 | |
| 52 | Moderate | 24 | |
| 126 | Unhealthy for Sensitive Groups | 25 | |
| 112 | Unhealthy for Sensitive Groups | 24 | |
| 69 | Moderate | 24 | |
| 84 | Moderate | 24 | |
| 87 | Moderate | 24 | |
| 65 | Moderate | 24 | |
| 58 | Moderate | 24 | |
| 86 | Moderate | 24 | |
| 64 | Moderate | 24 | |
| 62 | Moderate | 24 | |
| 77 | Moderate | 24 | |
| 63 | Moderate | 24 | |
| 71 | Moderate | 24 | |
| 106 | Unhealthy for Sensitive Groups | 24 | |
| 62 | Moderate | 24 | |
| 77 | Moderate | 24 | |
| 63 | Moderate | 24 | |
| 49 | Good | 24 | |
| 54 | Moderate | 24 | |
| 44 | Good | 27 | |
| 44 | Good | 13 — partial day |
Questions about Chicago
What is the air quality in Chicago right now?
Which monitor does this number come from?
How does Chicago compare with metros nearby?
Does this include pollen?
Put this number in context
Updated