
Right now: Minneapolis is at 23, good.
Is the air safe to breathe in Minneapolis today?
In Minneapolis, BreatheCheck reads 23 as Go. The cutoffs: go below 101, keep it short and easy from 101 to 150, move it indoors above 150. These are our own thresholds, drawn on the EPA bands — EPA itself classifies 101–150 as Unhealthy for Sensitive Groups and does not tell you how long to stay out.
Go AQI 0–100
Normal outdoor plans. No change needed.
Short & unloaded AQI 101–150
A 20-minute dog walk, not a 2.5-hour run. Keep it brief and easy.
Don’t go AQI 151+
Move it indoors. Above 200 that becomes everyone, not just sensitive groups.
Above 200 this stops being a personal call: everyone indoors.
Duration and intensity are two separate dials
| Under 20 min | 20–60 min | Over an hour | |
|---|---|---|---|
| Easy | Go | Go | Go |
| Moderate | Go | Go | Go |
| Hard | Go | Go | Go |
Go Every combination lands the same way at this reading — a hard hour is no different from an easy twenty minutes. The two dials separate above 80.
Where people actually draw the line
All the thresholds people reported, and who reported them
- 60 Asthmatic runnerone runner’s own 156-run log
- 75–100 Daycare / schoolparents and staff in one r/toddlers thread, Aug 2025 — not a published rule
- 100 Parentcommunity-reported, escalating at 150 and 200
- 110 Runnercommunity-reported
If you’re staying in, filter the room you’re actually in
That color and that number are today’s read on air quality Minneapolis residents are breathing right now. What matters more is what it means for the walk, the run, or the kid’s recess you’re deciding. A clear sky here doesn’t always mean a clean reading. This page tracks Minneapolis air day by day, not one headline number. Skip refreshing it. Set your number once and hear about the plume before you look outside.
How does today compare with Minneapolis’s record so far?
Since 16 August 2026 we have recorded 30 days for Minneapolis. 2 went above AQI 100, and the highest daily maximum was 152, on 29 August 2026. The day-by-day record is further down.
One reading tells you nothing about the pattern behind it. BreatheCheck tracks the air quality Minneapolis actually saw since we began measuring here, rebuilt from the same hourly AQI feed as the number above.
The page also carries a count of days above AQI 100 since we began counting. IQAir, AccuWeather, aqicn and Minnesota’s own Pollution Control Agency monitor grid all give today’s number and nothing behind it. None show a metro’s actual shape over time. A quiet stretch that turns bad within a day, once a Canadian smoke plume crosses the border, still counts here.
Why is it hazy in Minneapolis today?
Three things usually explain a Minneapolis sky that looks worse than the number, or the reverse. The AQI smooths recent hours together, weighted toward the latest, so one genuinely bad hour takes a few hours to show up in full. Smoke can also sit aloft, a few thousand feet up, above the ground-level monitor actually feeding the reading. A red-skied, 30-AQI Seattle photo made that “smoke aloft” mechanism famous on Reddit in August 2026.
It applies here too, whenever a Canadian plume moves through without fully mixing down yet.
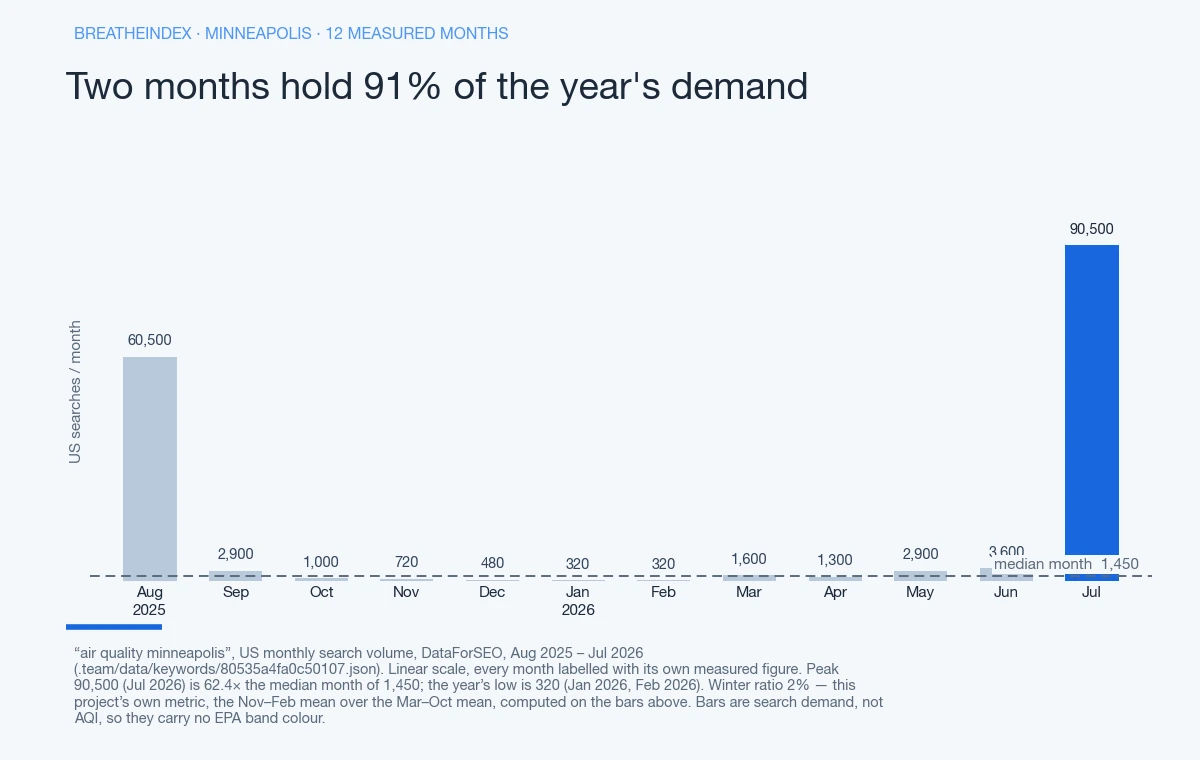
Or the nearest working station is miles off, reporting for a different pocket of the metro than the one you’re standing in. None of that makes a hazy day’s number fake, or a clear day’s bad reading wrong. It means the number is one reading, averaged at one location — not a live photo of your street. The plume that arrives first and the number that follows breaks down every cause.
What is causing the bad air in Minneapolis?
Minneapolis doesn’t sit in a mountain valley or a marine-flow basin — most bad-air days arrive from somewhere else. The dominant recent driver is Canadian wildfire smoke, mostly fine particulate matter (PM2.5), not the coarser PM10 dust that shows up in dust-storm cities. The same transport corridor also reaches Chicago, Milwaukee and Madison, and on the worst days, as far as New York and Pittsburgh.
Minneapolis and Chicago sit close enough on that path that a bad smoke week in one often overlaps with a bad one in the other. The exact lag isn’t measured here.
How bad the plume gets downstream is real. On July 16, 2026, Chicago’s own AQI chart broke. “The chart caps out at like 500 and the measurements are showing 700–800,” one Chicago resident wrote. The suburb of Northbrook read 938 that evening. A 65-year Chicago resident called the pattern new: “I have never smelled smoke from Canada until last summer.” Minneapolis wasn’t the metro in that thread. This is Chicago’s own account of the same corridor, not a Minneapolis reading — but it sits on the identical path. Ground-level ozone, invisible and odorless, can also push the number up with no smoke involved. That mechanism is covered in full on the AQI scale explained.
What makes the call different in Minneapolis?
Minneapolis sits under two separate smoke corridors, not one. A Canadian plume from the north and a western wildfire plume can each reach the Twin Cities independently, in different weeks, for different reasons. Go on an ordinary reading. Short and unloaded: a stroll to the corner store instead of the full lake loop. Don’t go once the number climbs into the red.
On EPA’s scale, everyone gets warned starting at 151, Unhealthy. 201 to 300, Very Unhealthy, is that same warning at a harsher level, not a different group. Past roughly 200, it doesn’t matter which corridor sent the smoke — the plan moves indoors.
What AQI should you stay inside?
Minnesota is one of only two states with a documented school or daycare AQI threshold. One Minnesota parent posted to r/toddlers in August 2025: “Our kid’s school does not go outside when the air quality is bad. I believe the center’s threshold is 100, because children are sensitive groups.” Washington runs a lower line — 75 at school and 80 at daycare, on the same thread.
That’s one parent’s account of one center — not a state regulation, and it’s cited at that size. One Minnesota centre and its reported AQI 100 sits alongside Washington’s 75; neither is checked against regulation text.
Adults set individual numbers well under that 100 line. On r/Marathon_Training, a runner wrote: “I’ll run in up to 110 because…error bars.” One asthmatic runner logged 156 runs against AQI and set a cutoff at 60. Past it, “my lungs struggle regardless of how well I’ve trained,” even though EPA calls nothing under 100 unhealthy. That log: 87% of runs under AQI 50 went fine, 42% between 50 and 70, just 12% above 70.
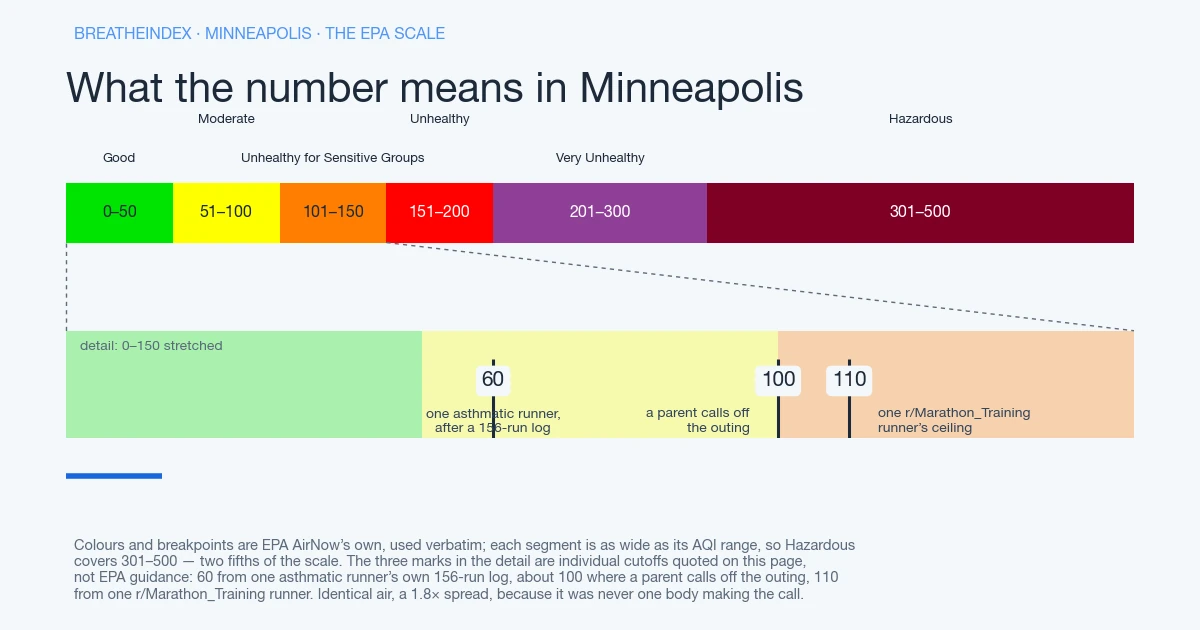
Whichever smoke corridor is active — Canadian or western — smoke pulls the whole table down roughly one EPA band. That’s different from an ordinary pollution day. EPA marks 101–150 as Unhealthy for Sensitive Groups — attributed to the agency, not a call on any one reader.
Indoors, default to a portable HEPA purifier or a Corsi-Rosenthal box, around $130 to build per one member’s 12x14 bedroom unit. Skip the whole-house MERV-13 swap unless a licensed tech has checked the system’s static pressure first. The three indoor levers, in order covers the rest.
Why our number may not match what you are seeing and smelling
The mismatch cuts both directions here. Direction one — hazy sky, quiet number — is usually smoke aloft or smoothing across recent hours catching up late. Direction two runs opposite: clear sky, no smoke smell, number still bad, usually because ground-level ozone is invisible and odorless.
One Denver resident who hit the same trap: “Spreading awareness about ozone is tough because it’s mostly invisible and odorless.” A parent stuck home with a toddler in Brooklyn described the identical gap: “My husband keeps saying it seems fine, it looks clear outside and doesn’t smell bad but I feel like all the harmful stuff is invisible.” Neither is Minneapolis — the mechanism is generic.
Today’s reading for Minneapolis comes from AirNow’s Twin Cities reporting area, whose reference point sits about 4.5 miles from the metro centre. As of .
A station miles off under-reports whichever side of the metro sits farthest from it. How this number is sourced, and what it averages away has the mechanics.
Does the Minneapolis AQI include pollen?
No — Minneapolis is a clean example of why that trips people up. Google runs no AI Overview on “pollen count minneapolis.” Three of the nine metros checked for this project skip a synthesized answer entirely: Minneapolis, Houston and Atlanta. The other six all get one. Minnesota’s Department of Health publishes a pollen portal directly, separate from the Pollution Control Agency’s current-AQI tool. Two agencies, two numbers — neither folded into the other.
That split isn’t unique to Minnesota; readers hit it everywhere. “What I loved about pollen.com is that it was all combined or customizable. Having to go through 6 different charts is a pain,” one commenter wrote after a popular tracker went down (4 upvotes). Another, at 6 upvotes: “I’ve yet to find an app that measures pollen like that app. Same with air quality index.” AQI doesn’t track pollen — it’s a separate metric, checked separately.
Why Minneapolis sits on two smoke corridors
Minneapolis groups with two smoke paths: the Upper Midwest / lake corridor, and a separate, longer Canadian plume path. Chicago, where the lake edge does the same thing, and Madison just inland of it, share the first corridor with Milwaukee. These metros sit close enough that one weather system often pushes smoke through more than one in the same week.
A separate, longer Canadian plume path has reached New York’s record July in past summers, and Pittsburgh’s river valleys and St. Louis see the same one, with Minneapolis and Chicago typically catching it first.
The calendar behind air quality Minneapolis sees each year doesn’t run on a fixed schedule the way a winter inversion does elsewhere. A hot Canadian fire season pushes smoke south for weeks; a quiet one barely registers here. Wind direction on a given week decides more than the date on the calendar.
Where this number sits
Of the 121 US metros reporting to us right now, Minneapolis is number 112 and number 2 of the 3 we track in Minnesota. The pollutant driving it today is PM2.5.
Nearby metros we also measure, and what they read at the same hour:
- St. Paul, MN — 9 miles away, AQI 23
- Rochester, MN — 77 miles away, AQI 24
- Sioux Falls, SD — 198 miles away, AQI 22
- Fargo, ND — 214 miles away, AQI 19
Where this reading comes from
AirNow’s Twin Cities reporting area, about 4.5 miles from the metro centre.
What has air quality in Minneapolis actually been?
2 of the 30 days we have recorded so far went above AQI 100.
| Date | Daily max AQI | EPA band | Hours read |
|---|---|---|---|
| 58 | Moderate | 23 | |
| 34 | Good | 24 | |
| 80 | Moderate | 24 | |
| 113 | Unhealthy for Sensitive Groups | 24 | |
| 51 | Moderate | 24 | |
| 55 | Moderate | 24 | |
| 57 | Moderate | 24 | |
| 54 | Moderate | 24 | |
| 57 | Moderate | 24 | |
| 48 | Good | 25 | |
| 62 | Moderate | 24 | |
| 87 | Moderate | 24 | |
| 74 | Moderate | 24 | |
| 53 | Moderate | 24 | |
| 61 | Moderate | 24 | |
| 60 | Moderate | 24 | |
| 152 | Unhealthy | 24 | |
| 60 | Moderate | 23 | |
| 82 | Moderate | 24 | |
| 64 | Moderate | 24 | |
| 67 | Moderate | 24 | |
| 65 | Moderate | 24 | |
| 95 | Moderate | 24 | |
| 91 | Moderate | 24 | |
| 60 | Moderate | 24 | |
| 69 | Moderate | 24 | |
| 70 | Moderate | 24 | |
| 56 | Moderate | 24 | |
| 51 | Moderate | 27 | |
| 34 | Good | 13 — partial day |
Questions about Minneapolis
What is the air quality in Minneapolis right now?
Which monitor does this number come from?
How does Minneapolis compare with metros nearby?
Does this include pollen?
Put this number in context
Updated