
Right now: Boise is at 32, good.
Is the air safe to breathe in Boise today?
In Boise, BreatheCheck reads 32 as Go. The cutoffs: go below 101, keep it short and easy from 101 to 150, move it indoors above 150. These are our own thresholds, drawn on the EPA bands — EPA itself classifies 101–150 as Unhealthy for Sensitive Groups and does not tell you how long to stay out.
Go AQI 0–100
Normal outdoor plans. No change needed.
Short & unloaded AQI 101–150
A 20-minute dog walk, not a 2.5-hour run. Keep it brief and easy.
Don’t go AQI 151+
Move it indoors. Above 200 that becomes everyone, not just sensitive groups.
Above 200 this stops being a personal call: everyone indoors.
Duration and intensity are two separate dials
| Under 20 min | 20–60 min | Over an hour | |
|---|---|---|---|
| Easy | Go | Go | Go |
| Moderate | Go | Go | Go |
| Hard | Go | Go | Go |
Go Every combination lands the same way at this reading — a hard hour is no different from an easy twenty minutes. The two dials separate above 80.
Where people actually draw the line
All the thresholds people reported, and who reported them
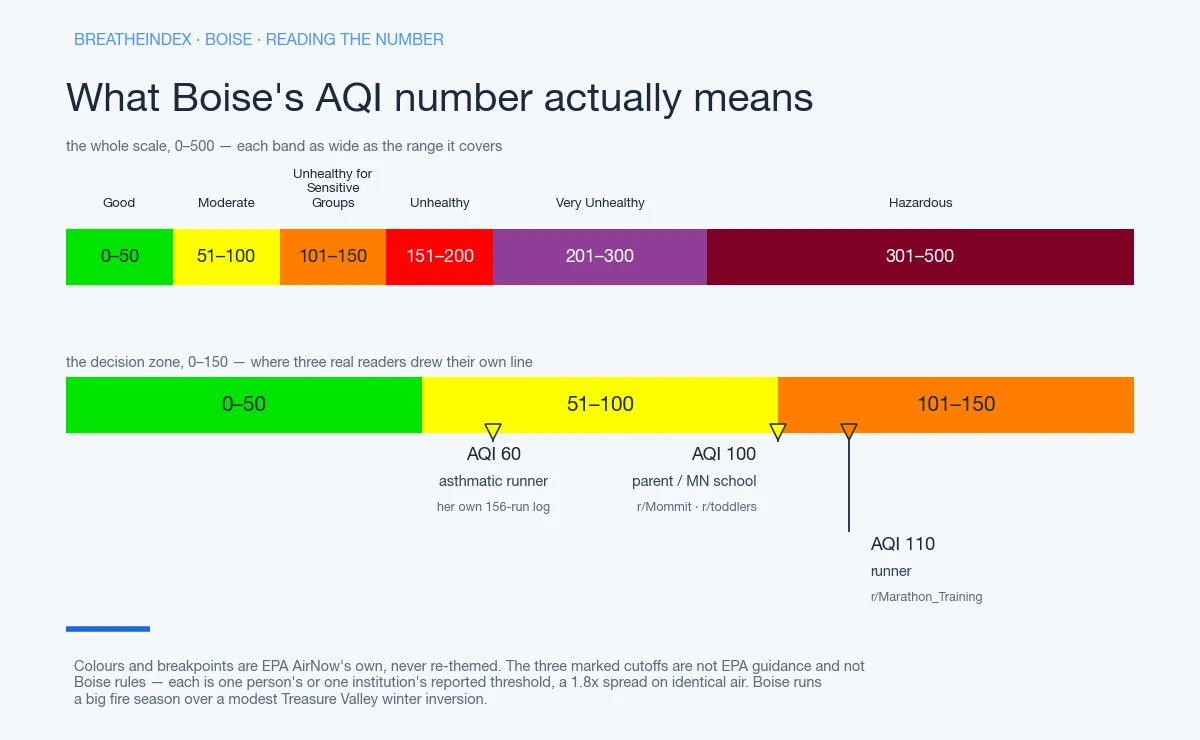
- 60 Asthmatic runnerone runner’s own 156-run log
- 75–100 Daycare / schoolparents and staff in one r/toddlers thread, Aug 2025 — not a published rule
- 100 Parentcommunity-reported, escalating at 150 and 200
- 110 Runnercommunity-reported
If you’re staying in, filter the room you’re actually in
That color and number are today’s call on Boise air quality. What they’re actually deciding is smaller than the headline: the river-trail run, the kid’s soccer practice, whether the windows stay open tonight. BreatheCheck tracks the air quality Boise has actually breathed since we began measuring here, not just the one figure refreshing above. Skip refreshing it yourself — an email when a plume pushes Boise past your number does the watching for you.
How does today compare with Boise’s record so far?
Since 16 August 2026 we have recorded 30 days for Boise. 2 went above AQI 100, and the highest daily maximum was 105, on 25 August 2026. The day-by-day record is further down.
One reading says nothing about the shape behind it. BreatheCheck rebuilds the air quality Boise has seen since we began measuring here, from the same hourly AQI feed as the number above.
The page also carries a running count of days above AQI 100 since we began counting. That shape is worth seeing on its own terms. Boise’s own search-demand average runs 12,100 a month. That’s more than Phoenix, the country’s fifth-largest city, at 9,300 — despite Boise being a fraction of its size. Demand for this page doesn’t track population; it tracks smoke and inversion exposure. IQAir, AccuWeather, aqicn and Idaho’s own monitor grid hand you today’s number and stop there. None tells you whether today is a typical month or an event.
Why is it hazy in Boise today?
Boise sits in the Treasure Valley, a low, wide basin the foothills and wider Great Basin wall in on most sides. That geography lets the valley hold onto what an open plain would blow through in an hour. Three things can also make the sky look worse than the number: 24-hour averaging, wildfire smoke sitting aloft, or a distant station.
Wildfire smoke is Boise’s biggest driver. The AQI smooths recent hours together, weighted toward the latest, so one rough afternoon can take a few hours to show up in full. Smoke can sit aloft above the monitor doing the measuring. Or the nearest working station is miles off, standing in for a valley wider than the city center it represents. None of that makes the haze fake. One number averages one location, not your block. Smoke sitting above the monitor, and the other five causes covers the national picture.
What is causing the bad air in Boise?
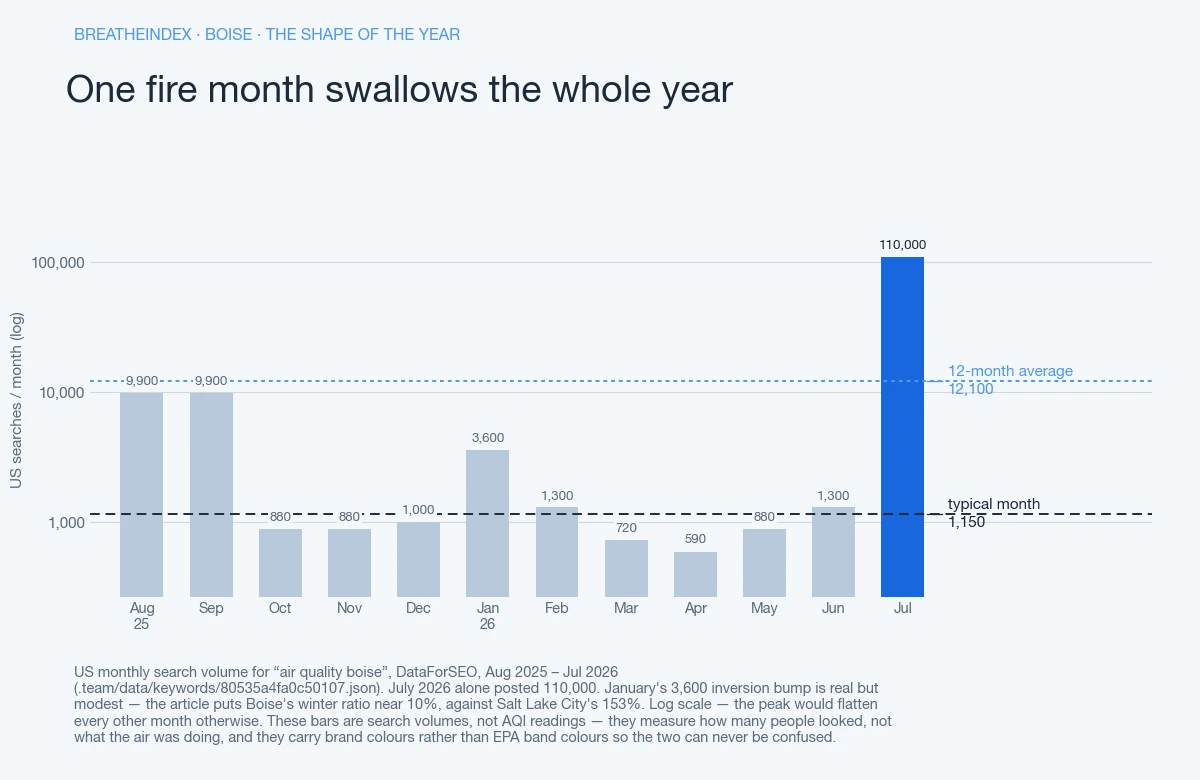
Two separate mechanisms drive bad air in Boise, and the search data shows both clearly. The smaller one is winter. On a still, cold day, the Treasure Valley traps dense air under a warmer layer above it. That’s a temperature inversion, the same broad mechanism behind Salt Lake City’s Wasatch Front winter cold air pool. Boise’s own winter version shows up as one clearly elevated month, not a multi-month run.
Reno runs a similar shape from the other side of the Sierra. Its winter share (39%) beats Boise’s own 10%, held down by one huge fire month. Its smoke usually starts across the state line in California rather than locally. January climbs to 3,600, well above the surrounding months. By April it’s down to a 12-month low of 590. Wood smoke and gas heating add to that PM2.5 winter signature once the valley inversion sets up.
The bigger mechanism, by a wide margin, is wildfire smoke. It rides in on regional wind from fires across the Pacific Northwest, Idaho and British Columbia — the same corridor reaching Seattle at its wet northern end, Spokane and Eugene at its southern edge. “Air quality boise” ran 9,900 in both August and September last year. It spiked to 110,000 in July 2026 — a single fire month outweighing most of the rest of the year combined. Fine particulate matter, PM2.5, dominates those months. A dry, windy stretch can lift coarser PM10 dust instead, off the valley floor’s exposed farmland, though smoke does most of the damage.
What makes the call different in Boise?
Wildfire smoke drives Boise’s worst air more than any single local source. That’s why the call below leans on how long a plume sits over the Treasure Valley, not on the season. Go: ordinary air, nothing to plan around. Short and unloaded: the short warmup jog instead of the tempo run. Don’t go: skip it outright.
EPA’s everyone-warning starts at 151, Unhealthy. 201 to 300, Very Unhealthy, is that same warning restated for a worse reading, not a new group getting pulled in. Once a plume pushes a reading past roughly 200, the basin holds it — staying in stops being optional.
What AQI should you stay inside?
No published Idaho rule sets a school or daycare AQI cutoff, as far as this project can confirm — nor does any other state in that material; Washington and Minnesota come up only as a teacher’s and parents’ accounts of their own centres. The reported Washington 75 and Minnesota 100 are the two on record. Ask your own provider for their written policy.
Smoke is Boise’s dominant source, and once a plume settles into the Treasure Valley, it drags every personal threshold down roughly one EPA band. EPA files 101–150 under the Unhealthy for Sensitive Groups band — attributed to the agency, not a verdict on any one reader.
Individual numbers still vary widely under that shift. A runner on r/Marathon_Training named a ceiling: “I’ll run in up to 110 because…error bars.” An asthmatic runner logged 156 runs against AQI instead and stopped at 60 — “my lungs struggle regardless of how well I’ve trained,” even though EPA calls nothing under 100 unhealthy. Their own numbers: 87% of runs under 50 went fine, 42% between 50 and 70, just 12% past 70. Parents this project has seen online set the bar around 100, the outing-cancelling point.
Indoors, default to a portable HEPA purifier or a Corsi-Rosenthal box — one community builder priced a 12x14 bedroom version at $130. A whole-house MERV-13 swap isn’t automatic during a smoke event; it needs a static-pressure check from a licensed tech first, since an undersized system chokes on it. The order to buy in, monitor before purifier covers the rest.
Why our number may not match what you are seeing and smelling
This cuts two directions. Direction one: the sky looks clear, the number is bad. Ground-level ozone is invisible and odorless — no smelling your way to a safe read on it, so check the number.
Direction two is the more common one here once a plume is active: the sky looks smoky, and the posted number stays surprisingly calm. That’s usually smoke sitting aloft above the monitor doing the measuring, or smoothing across recent hours holding back a rough afternoon into a moderate-looking daily figure. Neither direction means the number is wrong — it means the number and your senses are measuring different things.
Today’s reading for Boise comes from AirNow’s Boise reporting area, whose reference point sits about 1.1 miles from the metro centre. As of .
A station miles off under-reports whichever end of the Treasure Valley sits farthest from it. Why a Treasure Valley reading can lag what you’re standing in explains that gap.
Why Boise air gets worse in winter
Winter is real in Boise, just modest next to what summer brings. January climbs to 3,600, a clear bump against the surrounding months, before the year’s low of 590 in April. Recomputed against the full year — Nov-Feb mean over Mar-Oct mean — Boise’s winter ratio lands at roughly 10%. That’s a real signal, but modest next to Salt Lake City’s 153%.
An earlier pre-July-2026 pull had put that figure at 167%, since superseded. Spokane sits in the same Pacific Northwest smoke corridor but shows no comparable winter bump. Its own low point is April too, and nothing distinguishes December or January from it. Boise’s inversion season works the same way as the Wasatch Front’s. It just runs over a smaller Treasure Valley basin instead of Salt Lake City’s Great Salt Lake bowl. Salt Lake City backs its own inversion season with mandatory no-burn days. It calls a bad day a “red air day” once wintertime particulate crosses a set threshold. Sometimes that’s logged as an Air Quality Action Day rather than a plain alert. Nothing in the material reviewed here shows Boise running a comparable no-burn ordinance.
Summer still wins the year outright — and that’s what explains this page’s other oddity. Boise, Spokane and Pittsburgh each run 12,100 searches a month for their own air quality. That’s more than Phoenix’s 9,300 — and Phoenix is the fifth-largest city in the country. Boise isn’t. That gap is the clearest single proof in this project that demand doesn’t track population; it tracks smoke and inversion exposure instead. July 2026 alone posted 110,000 “air quality boise” searches, with August and September both running 9,900 the year before. The median month across the full year is 1,150. That’s the same bimodal shape as Sacramento’s winter inversion sitting under a much larger fire-season peak. Spokane’s pattern is fire-only. Salt Lake City’s is winter-dominant. Boise sits between them.
Where this number sits
Of the 121 US metros reporting to us right now, Boise is number 86 and the highest of the 2 we track in Idaho. The pollutant driving it today is O3.
Nearby metros we also measure, and what they read at the same hour:
- Idaho Falls, ID — 209 miles away, AQI 22
- Missoula, MT — 249 miles away, AQI 21
- Spokane, WA — 285 miles away, AQI 34
- Salt Lake City, UT — 296 miles away, AQI 44
Where this reading comes from
AirNow’s Boise reporting area, about 1.1 miles from the metro centre.
What has air quality in Boise actually been?
2 of the 30 days we have recorded so far went above AQI 100.
| Date | Daily max AQI | EPA band | Hours read |
|---|---|---|---|
| 46 | Good | 23 | |
| 74 | Moderate | 24 | |
| 63 | Moderate | 24 | |
| 59 | Moderate | 24 | |
| 67 | Moderate | 24 | |
| 61 | Moderate | 24 | |
| 66 | Moderate | 24 | |
| 46 | Good | 24 | |
| 59 | Moderate | 24 | |
| 61 | Moderate | 23 | |
| 61 | Moderate | 24 | |
| 52 | Moderate | 24 | |
| 65 | Moderate | 24 | |
| 77 | Moderate | 23 | |
| 72 | Moderate | 23 | |
| 98 | Moderate | 24 | |
| 63 | Moderate | 24 | |
| 78 | Moderate | 23 | |
| 85 | Moderate | 24 | |
| 84 | Moderate | 24 | |
| 105 | Unhealthy for Sensitive Groups | 24 | |
| 101 | Unhealthy for Sensitive Groups | 24 | |
| 74 | Moderate | 23 | |
| 97 | Moderate | 24 | |
| 90 | Moderate | 24 | |
| 97 | Moderate | 24 | |
| 97 | Moderate | 24 | |
| 73 | Moderate | 24 | |
| 61 | Moderate | 27 | |
| 58 | Moderate | 13 — partial day |
Questions about Boise
What is the air quality in Boise right now?
Which monitor does this number come from?
How does Boise compare with metros nearby?
Does this include pollen?
Put this number in context
Updated